Description
Calculates the sum, minimum, maximum, average, median, standard deviation or mode of numeric values by column or row in one or more selected columns.
Example
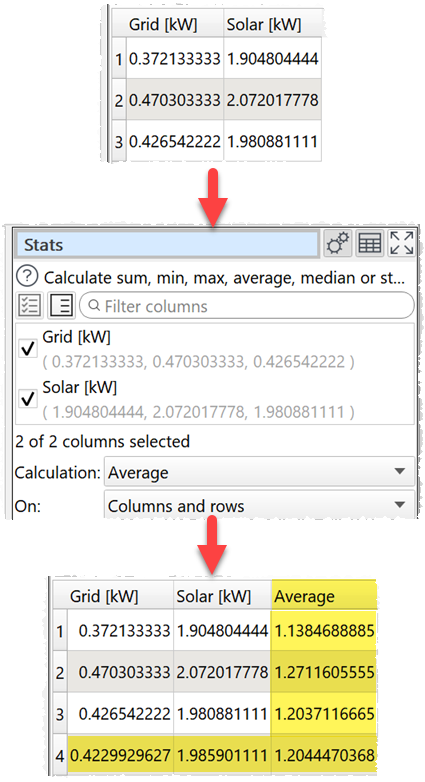
Calculate column and row averages:

Inputs
One.
Options
•Check the column(s) you wish to calculate stats for.
•Set Calculation to the statistic you want to calculate:
oSum show the sum of the values.
oMinimum shows the smallest value.
oMaximum shows the largest value.
oAverage shows the arithmetic mean of the values.
oMedian shows the median of numeric values in the column.
oMode shows the mode of numeric values in the column.
oStandard deviation is the sample standard deviation (equivalent to Excel function stddev.s).
•Set On depending on whether you wish to calculate the statistics for columns, rows or both.
oIf On is set to Columns an extra row with the results is added to the bottom.
oIf On is set to Rows an extra column with the results is added to the right.
oIf On is set to Columns and rows an extra row with the results is added to the bottom and extra column with the results is added to the right. The bottom right cell contains the calculation across all values.
Notes
•Non-numerical and empty values are ignored.
•Mode may not work as expected with non-integer values, due to precision issues. You can fix this by using a Num Format transform first.
•Use Num Format to change the precision of the results.