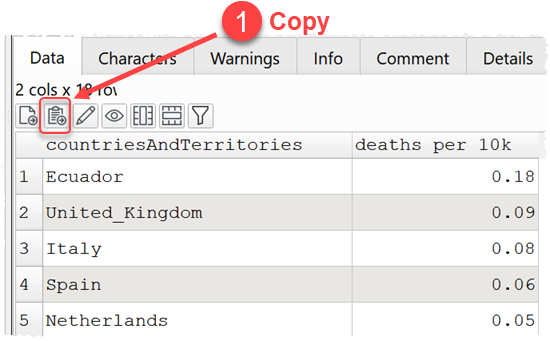
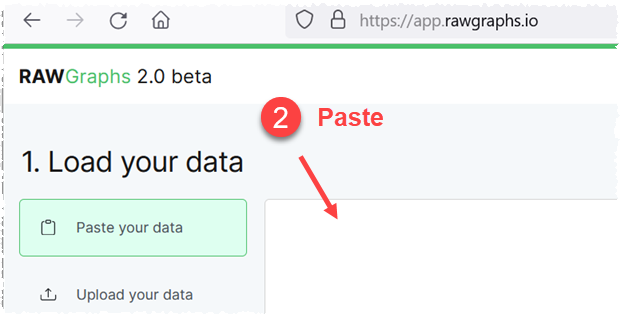
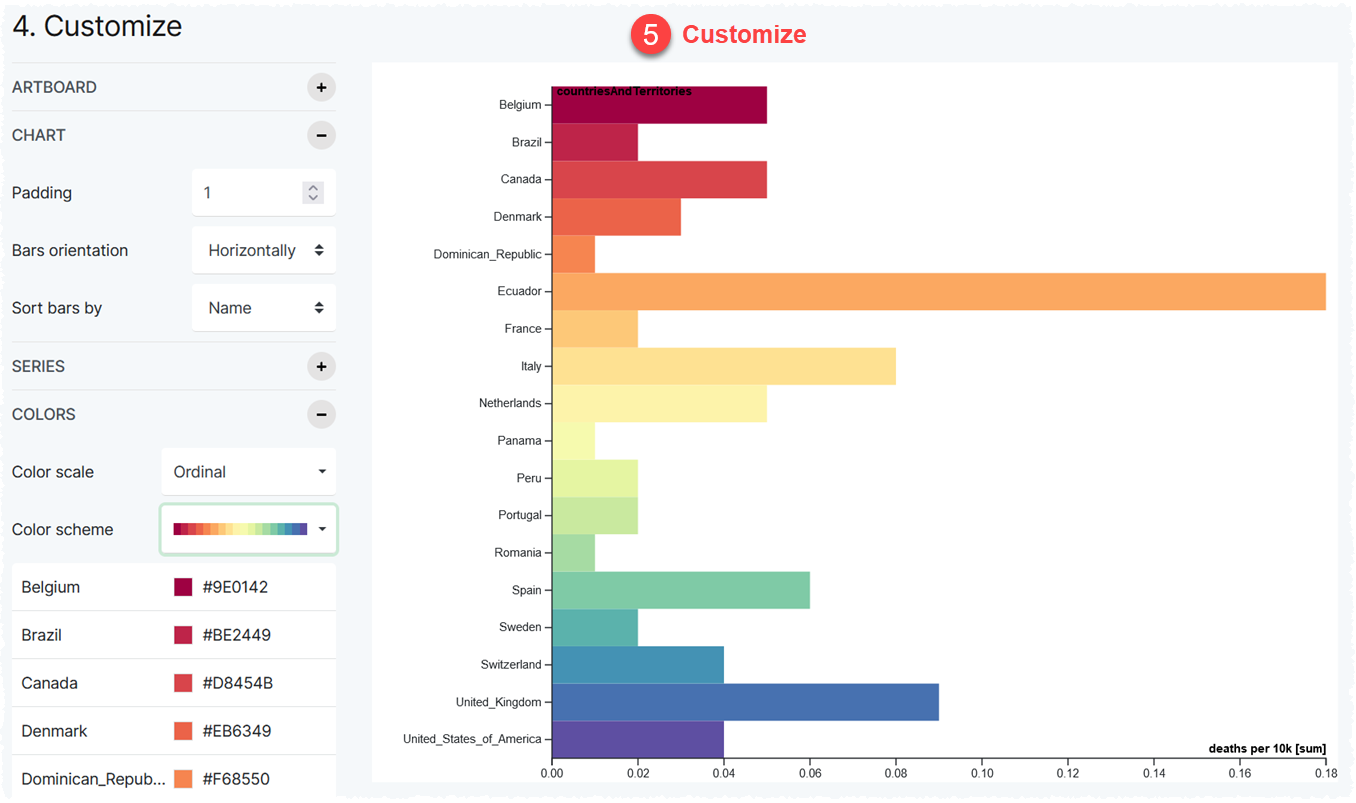
Currently Easy Data Transform does not support charting beyond data profiling. However it can easily integrate with other tools that do. For example. by outputting a CSV for import into the visualization tool, or copying and pasting via system clipboard.
For example, you can copy and paste data direct from Easy Data Transform to rawgraphs.io:


See also:
•Video: How to visualize data with rawgraphs.io