We struggled to find any benchmarks for a range of data wrangling/ETL[1] software, so we have done our own. This page show results from performance benchmarking the following on-premise (non-cloud) products using a 1 million row dataset:
- R
- R + dplyr
- R + data.table
- Python + Pandas
- Knime
- Power Query
- Easy Data Transform (our product)
We also make some comments on the following products, but their licenses don’t allow for competitive benchmarking:
- Tableau Prep
- Alteryx
The benchmark:
- reads in a 1 million row x 7 column dataset from a CSV file
- creates a new dataset by sorting in ascending order of the ‘id5’ column
- inner joins the original and sorted datasets using the ‘id6’ column
- writes the joined dataset to a CSV file
Each run was done from scratch. The average time from 3 runs was taken (apart from Power Query, which we only did once because it was so sloooow). We used default settings for each product. It is a very simple benchmark, but we hope it gives an idea of the relative performance.
While we have a horse in this race, we have tried to be fair to all products. But we aren’t experts in R, Python + Pandas, Knime, Tableau Prep, Alteryx or Power Query. Also, exact comparisons aren’t really possible. If you think we have done something that represents them unfairly, please let us know.
Results
Windows desktop
| type: | Windows desktop PC |
| processor: | AMD Ryzen 7 3700X 8-Core Processor 3.59 GHz with NVIDIA GeForce GTX 1660 |
| memory: | 16GB |
| disk: | SSD |
| OS: | Windows 10 64 bit |
| Time taken (seconds) | Easy Data Transform | R | R + dplyr | R + data.table | Python + Pandas | Knime | Power Query |
|---|---|---|---|---|---|---|---|
| read CSV | 2.94 | 5.58 | 0.88 | 0.53 | 0.58 | 1.58 | 3.85 |
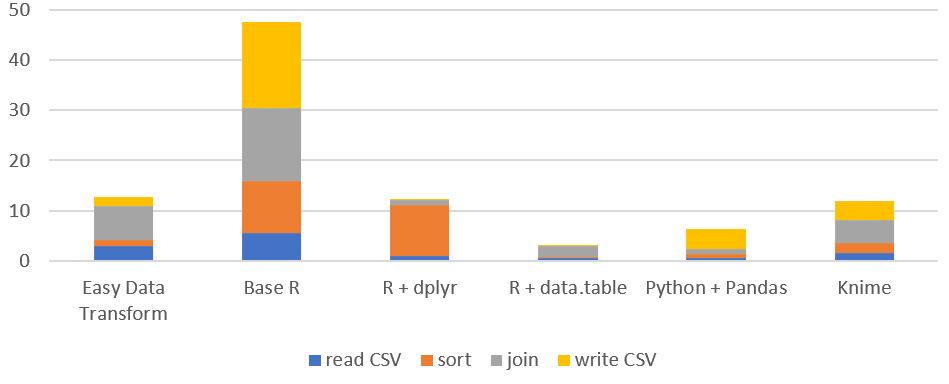
| sort | 1.14 | 10.31 | 10.28 | 0.33 | 0.85 | 1.91 | 4.65 |
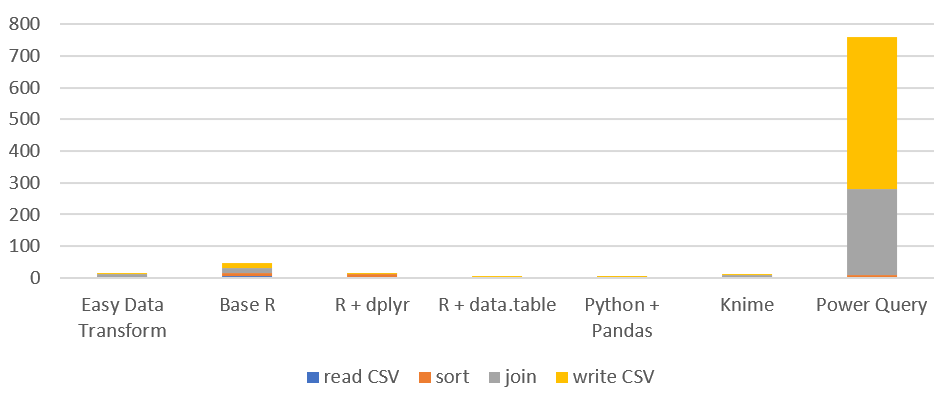
| join | 6.86 | 14.66 | 0.96 | 2.03 | 0.87 | 4.58 | 271.00 |
| write CSV | 1.78 | 17.01 | 0.12 | 0.10 | 4.15 | 3.87 | 480.27 |
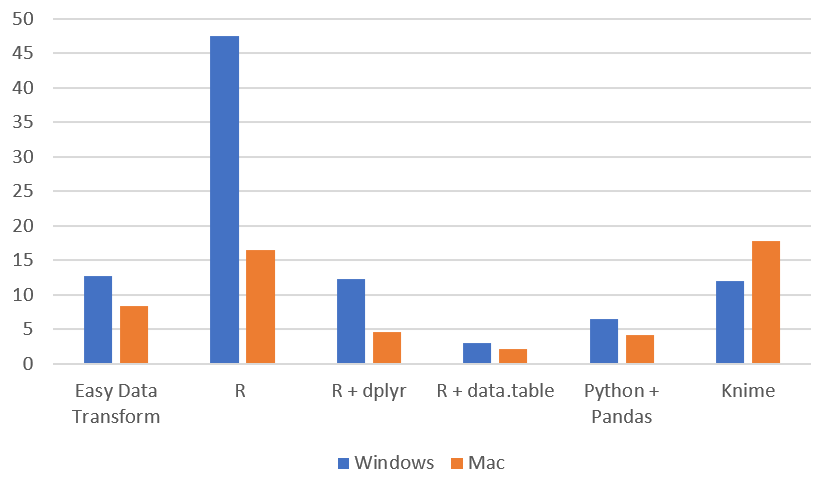
| total | 12.71 | 47.56 | 12.24 | 2.99 | 6.44 | 11.95 | 759.77 |
| memory used (MB) | 865 | 538 | 377 | 303 | 363 | 7495 | 1341 |
Versions:
Easy Data Transform v1.37.0
R v4.2.2
Python v3.9.7
Pandas v1.5.1
Knime v4.3.2
Excel v2210 64 bit
Mac laptop
| type: | MacBook Air laptop |
| processor: | Apple M1 |
| memory: | 8GB |
| disk: | SSD |
| OS: | macOS 13.0.1 |
| Time taken (seconds) | Easy Data Transform | R | R + dplyr | R + data.table | Python + Pandas | Knime |
|---|---|---|---|---|---|---|
| read CSV | 1.66 | 3.41 | 0.70 | 0.58 | 0.49 | 2.18 |
| sort | 0.51 | 3.68 | 3.12 | 0.22 | 0.66 | 2.28 |
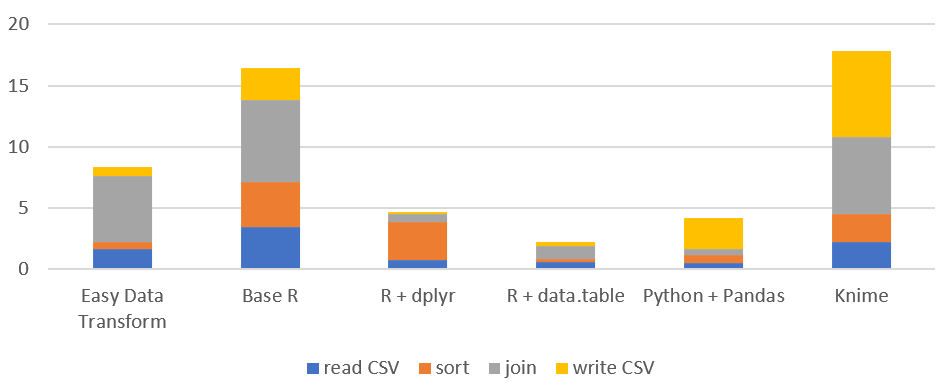
| join | 5.43 | 6.77 | 0.67 | 1.10 | 0.45 | 6.36 |
| write CSV | 0.70 | 2.58 | 0.13 | 0.29 | 2.58 | 7.01 |
| total | 8.31 | 16.43 | 4.62 | 2.18 | 4.19 | 17.84 |
| memory used (MB) | 791 | 680 | 396 | 310 | 357 | 2750 |
Versions:
Easy Data Transform v1.37.0
R v4.2.2 for ARM
Python v3.9.6
Pandas v1.5.1
Knime v4.6.3
Charts
Time by task (seconds), on Windows (smaller is better):
Time by task (seconds), on Windows without Power Query (smaller is better):
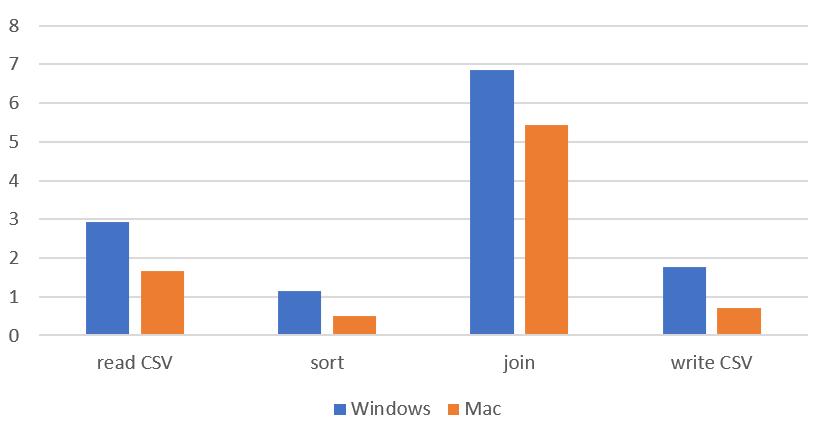
Time by task (seconds) on Mac (smaller is better):
Time total (seconds), Windows vs Mac (smaller is better):
Memory usage (MB), Windows vs Mac (smaller is better):
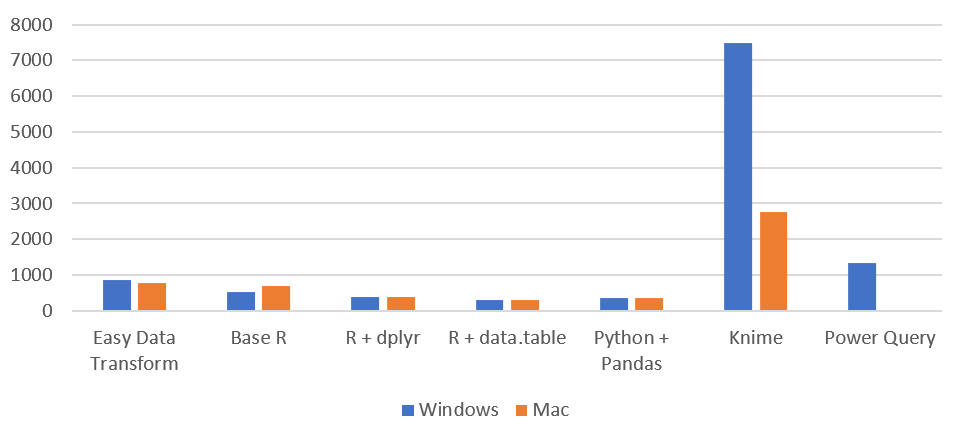
Looking at just the Easy Data Transform results, it is interesting to notice that a newish Macbook Air M1 laptop is significantly faster than an AMD Ryzen 7 desktop PC from a few years ago.
Time by task (seconds), Easy Data Transform only, Windows vs Mac (smaller is better):
Commentary
These products take 3 different approaches:
- Easy Data Transform, Knime, Tableau Prep and Alteryx are graphical, no-code/low-code, drag and drop software.
- R and Python are languages. data.table and dplyr are R packages. Pandas is a Python library.
- Power Query is part of Excel.
Each of the different approaches have strengths and weaknesses. Learning a programming language gives more flexibility but with a much steeper learning curve, especially if you aren’t an experienced programmer. Which product is the best choice depends on the job in hand, the skills of the user and the budget available.
Also R, Python + Pandas, Knime and Alteryx all come with bewildering arrays of optional extras for machine learning, forecast, heavy duty stats etc. Easy Data Transform and Tableau Prep are focussed on data wrangling.
Easy Data Transform
Easy Data Transform is a graphical drag and drop tool for data wrangling and analytics. It is available for Windows and Mac.
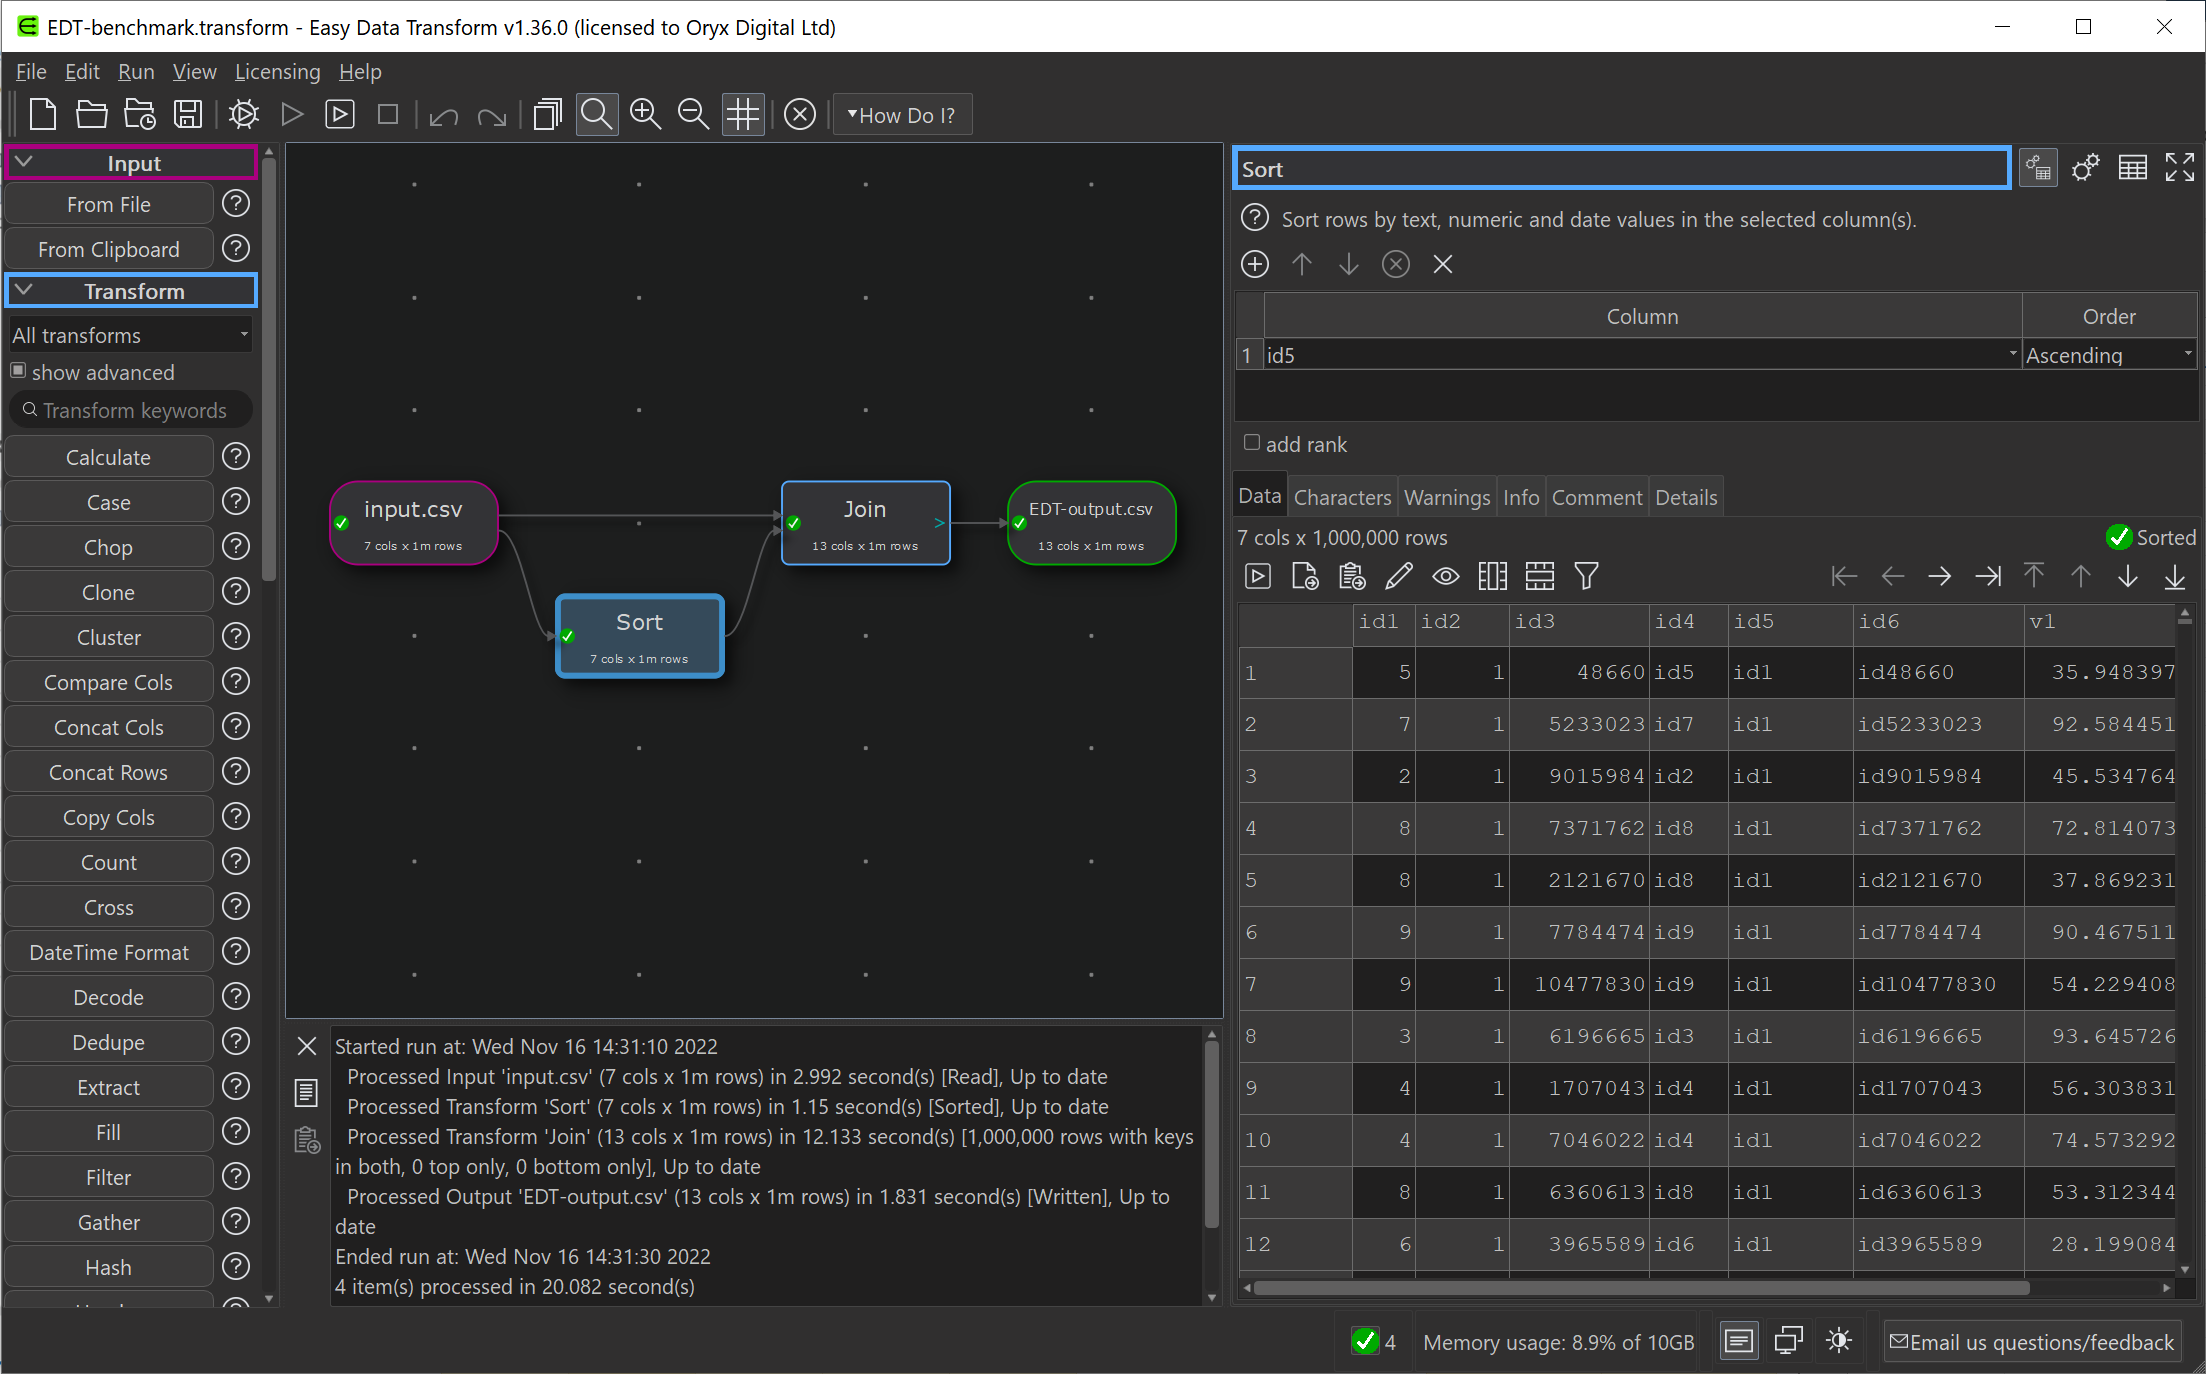
Our main aim with Easy Data Transform has been to create a data wrangling tool with an easy learning curve, that you don’t need to be a data scientist or programmer to use. But we haven’t neglected performance. It is written in C++ with in-memory compression and reference counting for efficiency, so it is fast even though it is currently only single threaded and doesn’t use the graphics card GPU[2].
We can improve the performance from the default by changing the following options:
- for the input CSV file set Delimiter to Comma, set Quoting to Unquoted, uncheck trim whitespace, uncheck simplify whitespace and uncheck ignore empty rows
- set Optimize processing for to Maximum speed in Preferences.
On Windows this reduces the total time from 12.71 to 8.16 seconds, but at the cost of using more memory.
Hopefully we will get closer to data.table and Pandas performance in time.
The cost of an Easy Data Transform license is $99 (one-time fee).
You can download a free trial of Easy Data Transform here. You don’t have to provide any details.
R
R (also known as ‘base R’ without extra packages such as dplyr and data.table) is a programming language aimed at statistical computing. It is commonly used for data wrangling. It is available for Windows, Mac and Linux.
The R benchmark script is:
library(tictoc)

tic( "total")

tic( "load input" )
input <- read.csv("C:/datatransform/benchmark/input.csv")
toc()

tic( "sort" )
sorted <- input[ order( input$id5 ) , ]
toc()

tic( "merge" )
m <- merge( x = input, y = sorted, by = "id6" )
toc()

tic( "write" )
write.csv( m,"C:/datatransform/benchmark/R-output.csv",
row.names = FALSE )
toc()

toc()
R performed significantly better on the ARM Mac than Windows.
We noticed that R is much faster joining on integer (rather than string) keys, which we didn’t test here.
R is free. There are also paid commercial products, such as RStudio Desktop Pro which you can license for $995 per year.
You can download R here.
R + dplyr
dplyr is an R package. It is part of the Tidyverse collection of R packages. It is available for Windows, Mac and Linux.
The R + dplyr benchmark script is:
library(tictoc)
library(dplyr)
library(readr)

tic( "total dplyr")

tic( "load input" )
input <- read_csv( "C:/datatransform/benchmark/input.csv", show_col_types = FALSE )
toc()

tic( "sort" )
sorted <- arrange( input, id5 )
toc()

tic( "merge" )
m <-  left_join( input, sorted, by = "id6" )
toc()

tic( "write" )
write_csv( m, "C:/datatransform/benchmark/R-dplyr-output.csv" )
toc()

toc()
R + dplyr is much faster than base R, but somewhat let down by the time taken for the sort transform compared to R + data.table.
We understand that there is a variant of R + dplyr that uses DuckDB and may be even faster than R + data.table, but we didn’t test it here.
dplyr is a free R package.
R + data.table
data.table is an R package with a high performance data frame implementation. It is available for Windows, Mac and Linux.
The R + data.table benchmark script is:
library(tictoc)
library(data.table)

tic( "total data.table")

tic( "load input" )
input <- fread( "C:/datatransform/benchmark/input.csv" )
toc()

tic( "sort" )
sorted <- input[ order( id5 ) ]
toc()

tic( "merge" )
m <-  input[sorted, on = "id6"]
toc()

tic( "write" )
fwrite( m, "C:/datatransform/benchmark/R-dt-output.csv" )
toc()

toc()
data.table speeds up R massively and makes it the fastest here.
data.table is a free R package.
Python + Pandas
Python is a programming language. Pandas is a data wrangling library for Python based on NumPy. Python is available for Windows, Mac, Linux and other platforms.
The Python + Pandas benchmark script is:
import pandas as pd
import time

read1timestart = time.time()
inputtable = pd.read_csv( "C:\\datatransform\\benchmark\\input.csv" )
read1timeend = time.time()
print( "read csv", read1timeend - read1timestart )

sorttimestart = time.time()
sortedtable = inputtable.sort_values( 'id5' )
sorttimeend = time.time()
print( "sort", sorttimeend - sorttimestart )

jointimestart = time.time()
joinedtable = pd.merge( inputtable, sortedtable, on='id6' )
jointimeend = time.time()
print( "join", jointimeend - jointimestart )

outputtimestart = time.time()
joinedtable.to_csv( "C:\\datatransform\\benchmark\\PANDAS-output.csv" , index=False )
outputtimeend = time.time()
print( "write", outputtimeend - outputtimestart )
While Python on it’s own isn’t fast (being an interpreted language), the Pandas library is fast.
We understand Pandas can be configured to use the GPU, but we didn’t attempt that here.
We noticed that Python + Pandas changes floating point numerical values. For example it inputs:
0.007004
And outputs:
0.007004000000000001
The other products didn’t have this issue (presumably because they are processing that column as strings, rather than converting to floating point and back). We assume there is some way around it.
Python + Pandas is free.
You can install Pandas using the pip Python installer.
Knime
Knime is a graphical drag and drop tool for data wrangling and analytics. It is available for Windows, Mac and Linux.
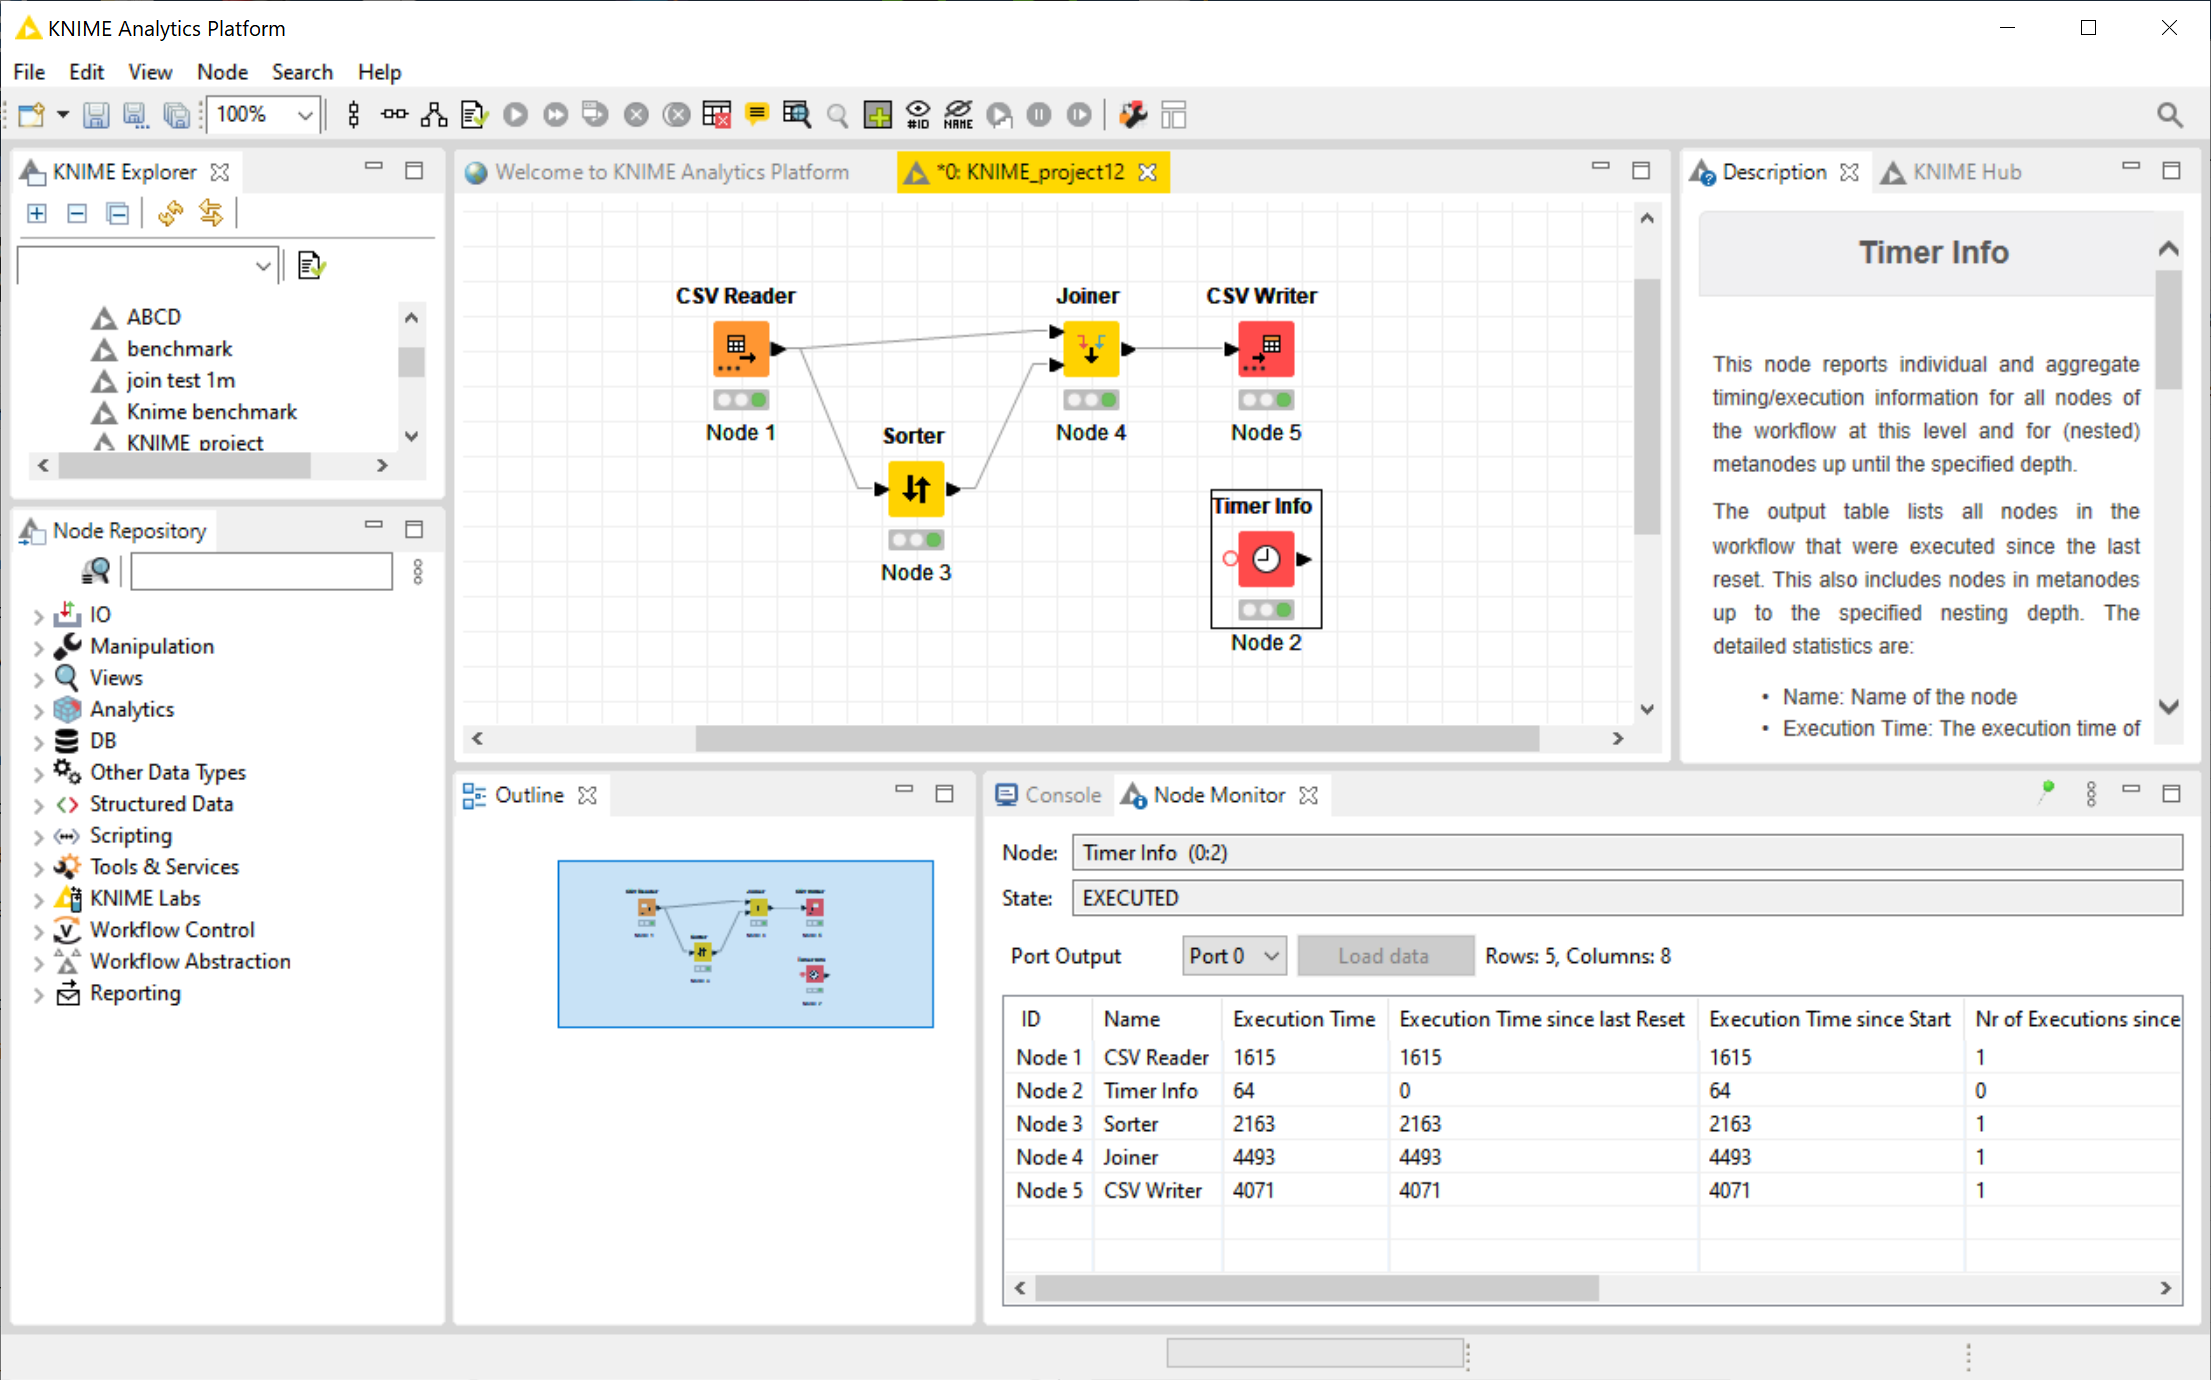
It is noticeable that Knime is slower on the Mac than Windows, while it was the opposite for all the others. Possibly this is because Knime isn’t optimized for Apple silicon.
The user interface of Knime feels a bit ‘klunky’ and dated to us, with lots of use of modal dialog windows. But obviously, we’re biased.
Knime uses a lot of RAM.
Knime Desktop is free (the server isn’t).
You can download Knime here. You have to provide your details.
Power Query
Power Query is part of Excel for Windows. Apparently a Mac version is in beta.
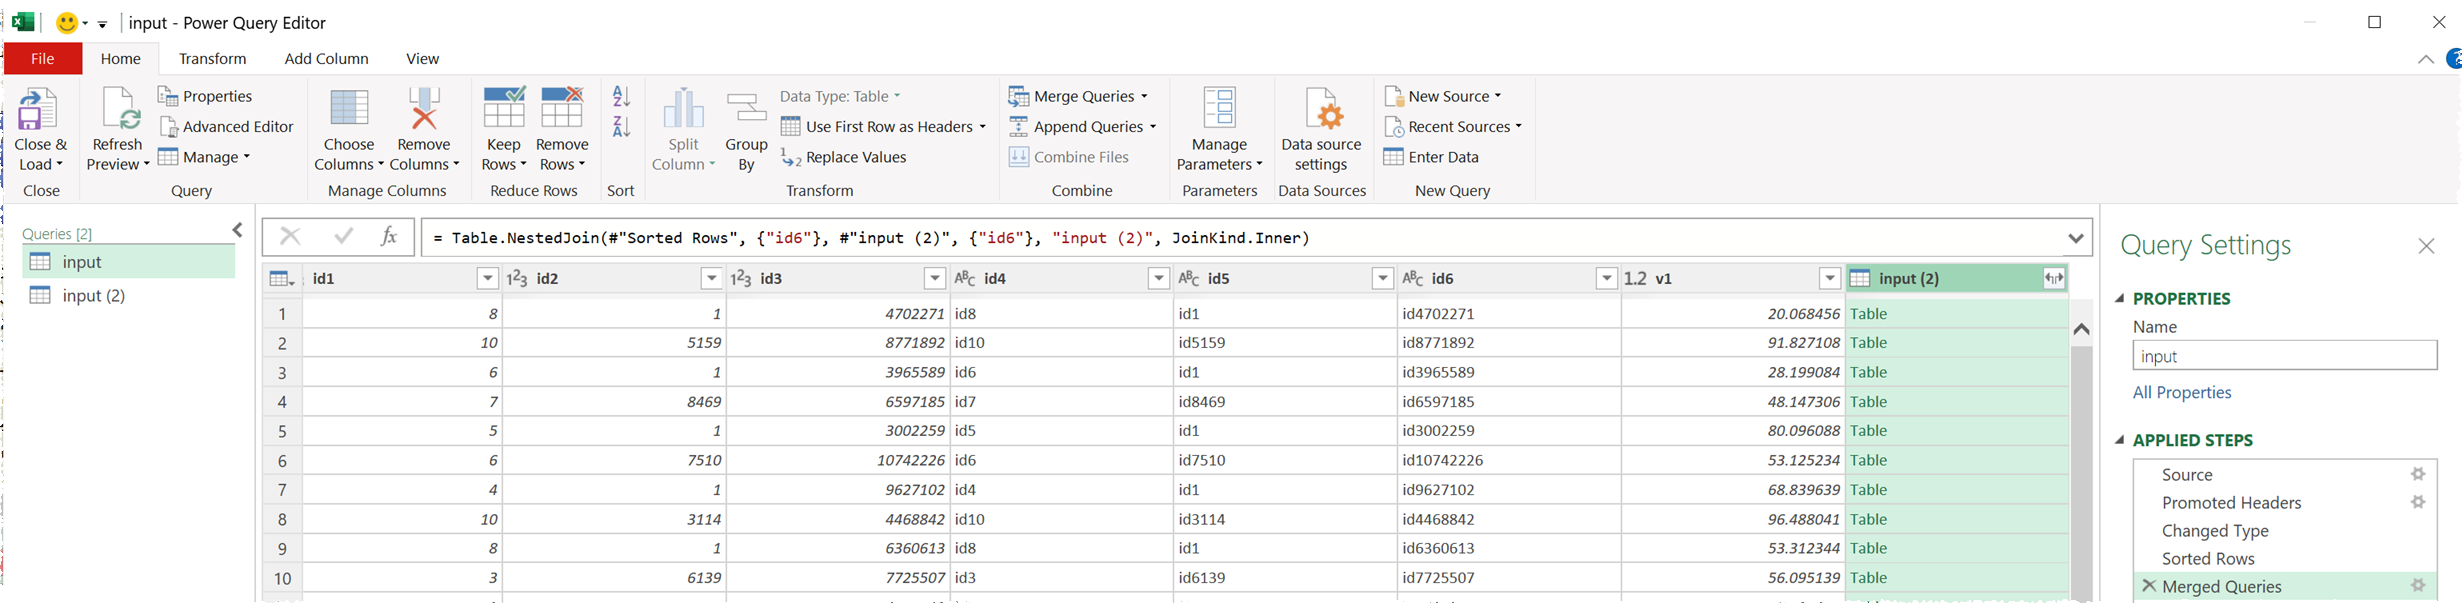
We found Power Query to be slow, unintuitive and frustrating. The lack of a graphical canvas makes it quite hard to manage workflows that merge and split data sources. We couldn’t work out how to join a sorted version of a dataset to an unsorted version, so we had to input the data a second time for the join (not counted in the benchmark).
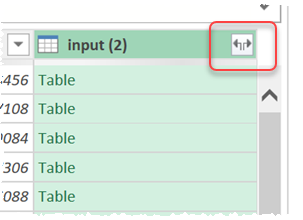
To actually see the full merged table we had to click on an expand button. This took another 40 seconds (not counted in the benchmark).
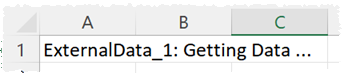
The benchmark for outputting to CSV includes 475 seconds (!) loading the merged dataset back to Excel and 5.27 seconds to actually save to CSV file. We got used to seeing this:
Apparently there is some way to save CSV from Power Query via the DAX Studio add-in, but we couldn’t find DAX Studio in the list of available add-ins for our version of Excel.
We couldn’t see any information on the time taken for each step, so we had to use a stopwatch.
The Power Query editor wasn’t available on our 2022 Mac copy of Excel (v16.67). We did try using the Power Query load option to load the input.csv file into Excel. We gave up timing this load after 10 minutes.
Power Query comes for no extra cost if you already have an Excel license for Windows. That is about the only positive thing we can find to say about it. Maybe it is more usable when you are dealing with smallish .xlsx files.
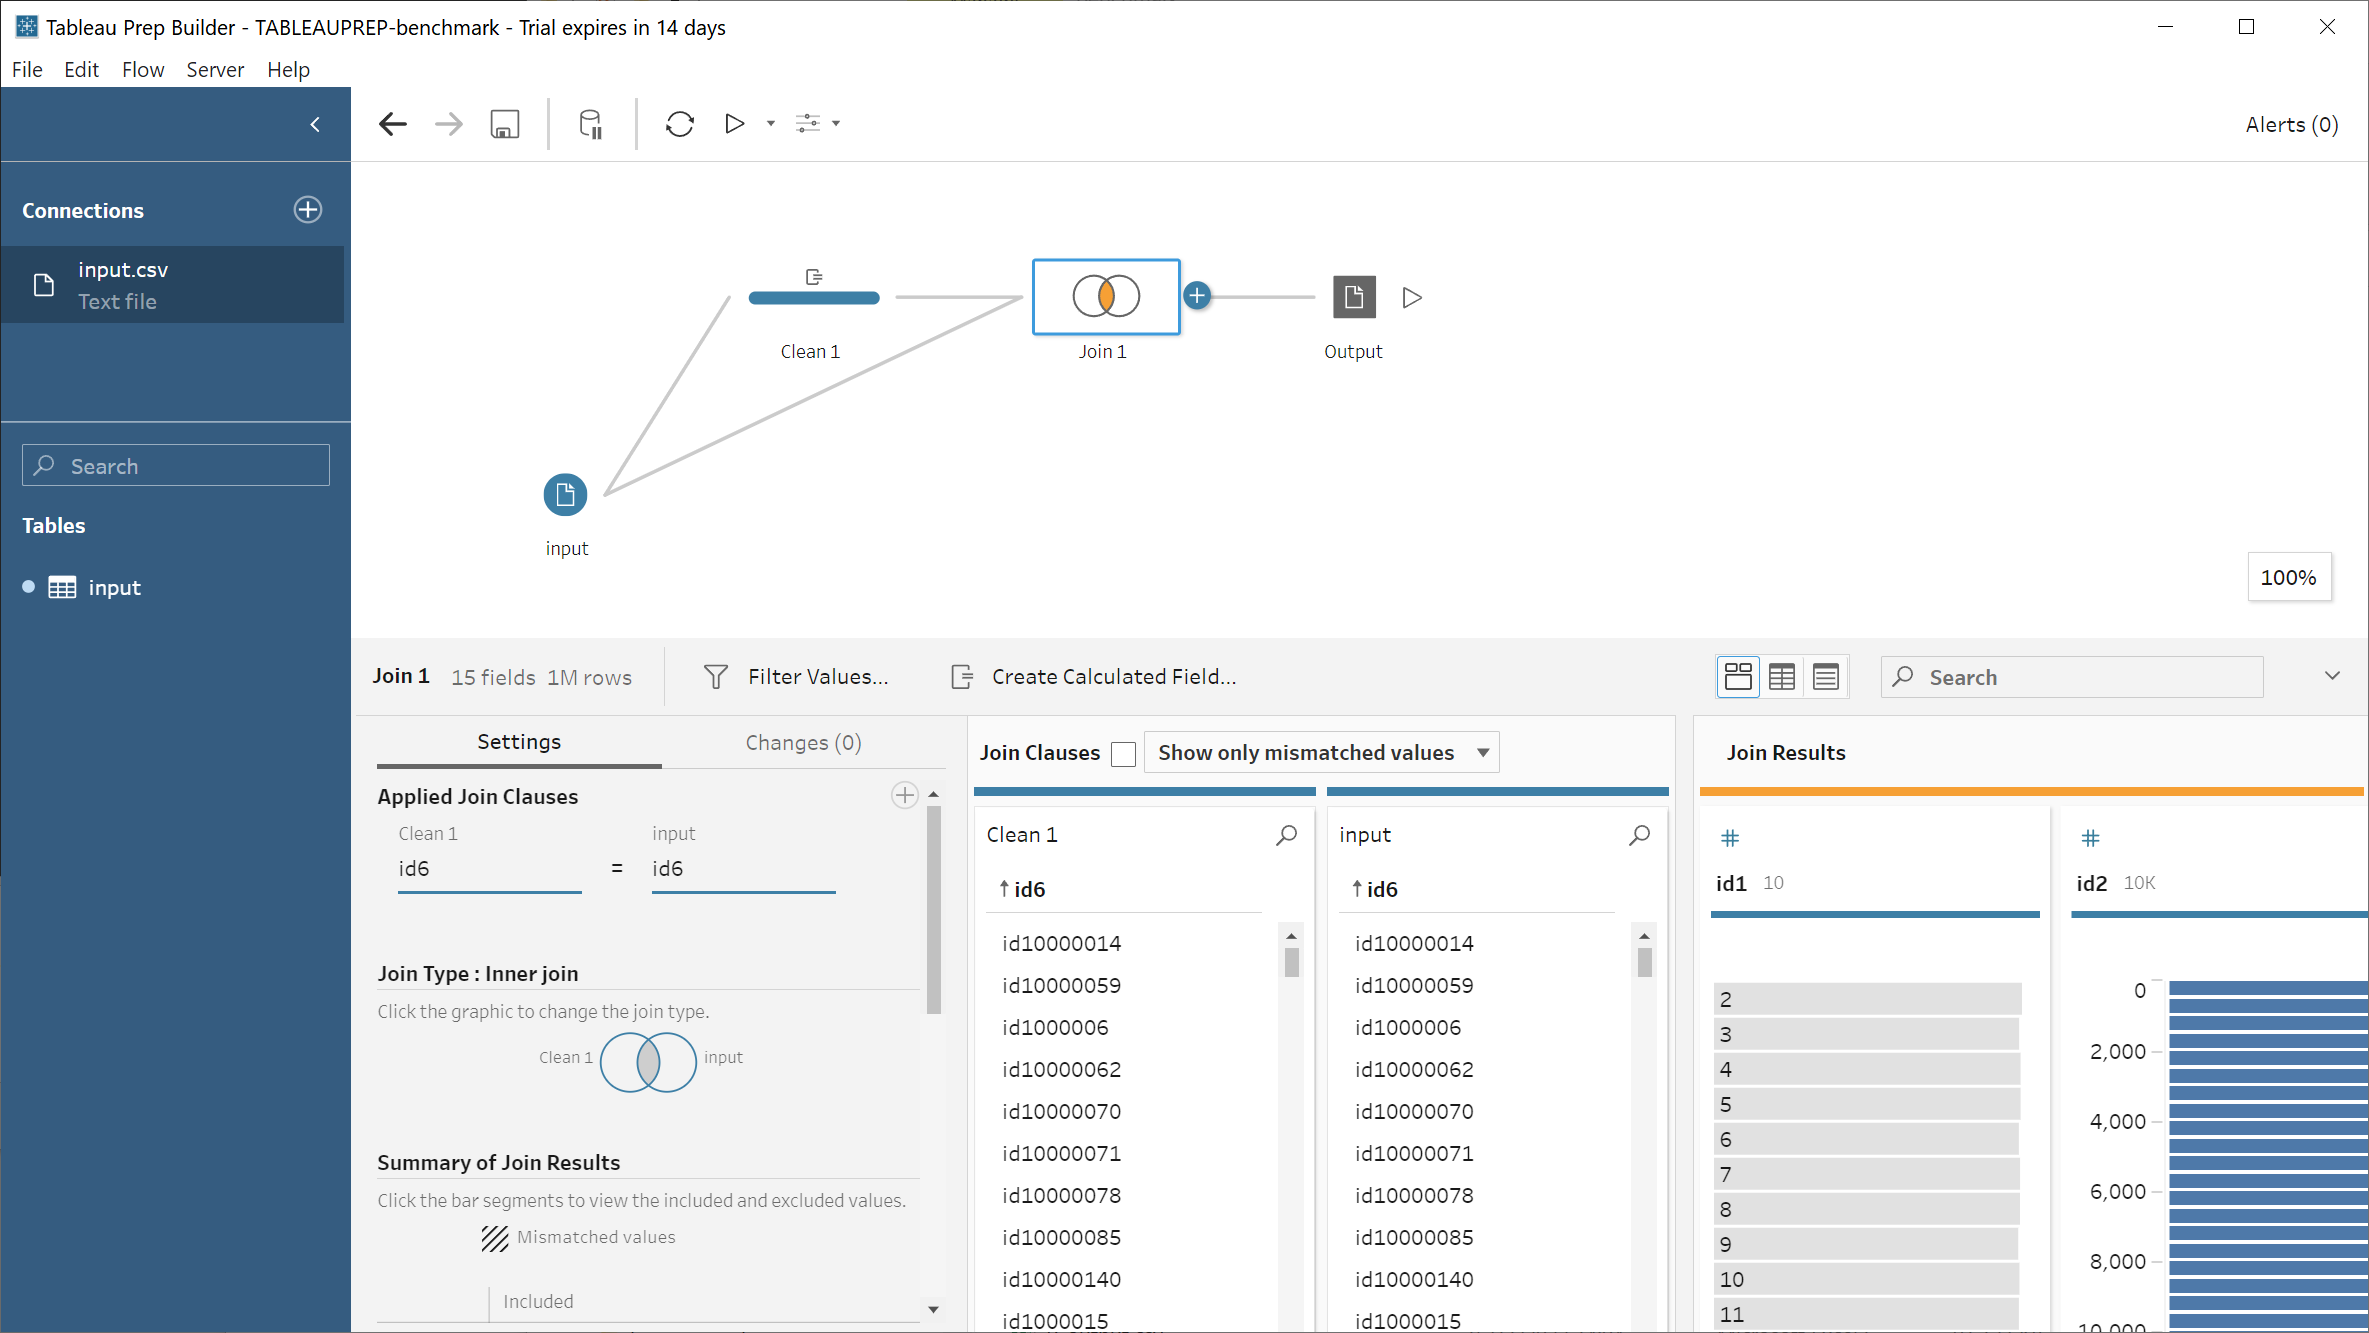
Tableau Prep
Tableau Prep is a graphical drag and drop tool for data wrangling and analytics. It is available for Windows and Mac.
We wanted to include Tableau Prep figures in this benchmark. However their licensing explicitly forbids competitive benchmarking.
With Tableau Prep it seems that you have to run the whole workflow via Flow>Run all or per output. We couldn’t see any way to run one transform at a time or run only changes.
Tableau Prep doesn’t seem to have a sort transform, so we had to do this by creating a clean step with a calculated field and then delete it afterwards, which seems awkward.
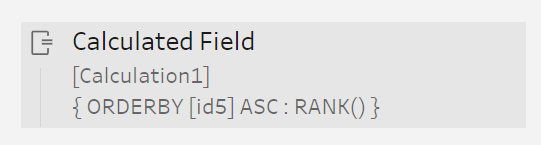
Tableau Prep has a fairly limited range of output file types compared to other products, presumably because it is mainly intended to be use to create .hyper files for Tableau’s visualization products.
Weirdly, Tableau Prep crashed every single time we took a screenshot of it on Windows using SnagIt. It is the only crash we saw during this benchmark.
Tableau Prep comes as part of the Tableau Creator bundle, a license for which is $70 per month (12 x $70 = $840 per year).
You can download a free trial of Tableau Prep here. You have to provide your details (twice - once on the website, once when you start the trial).
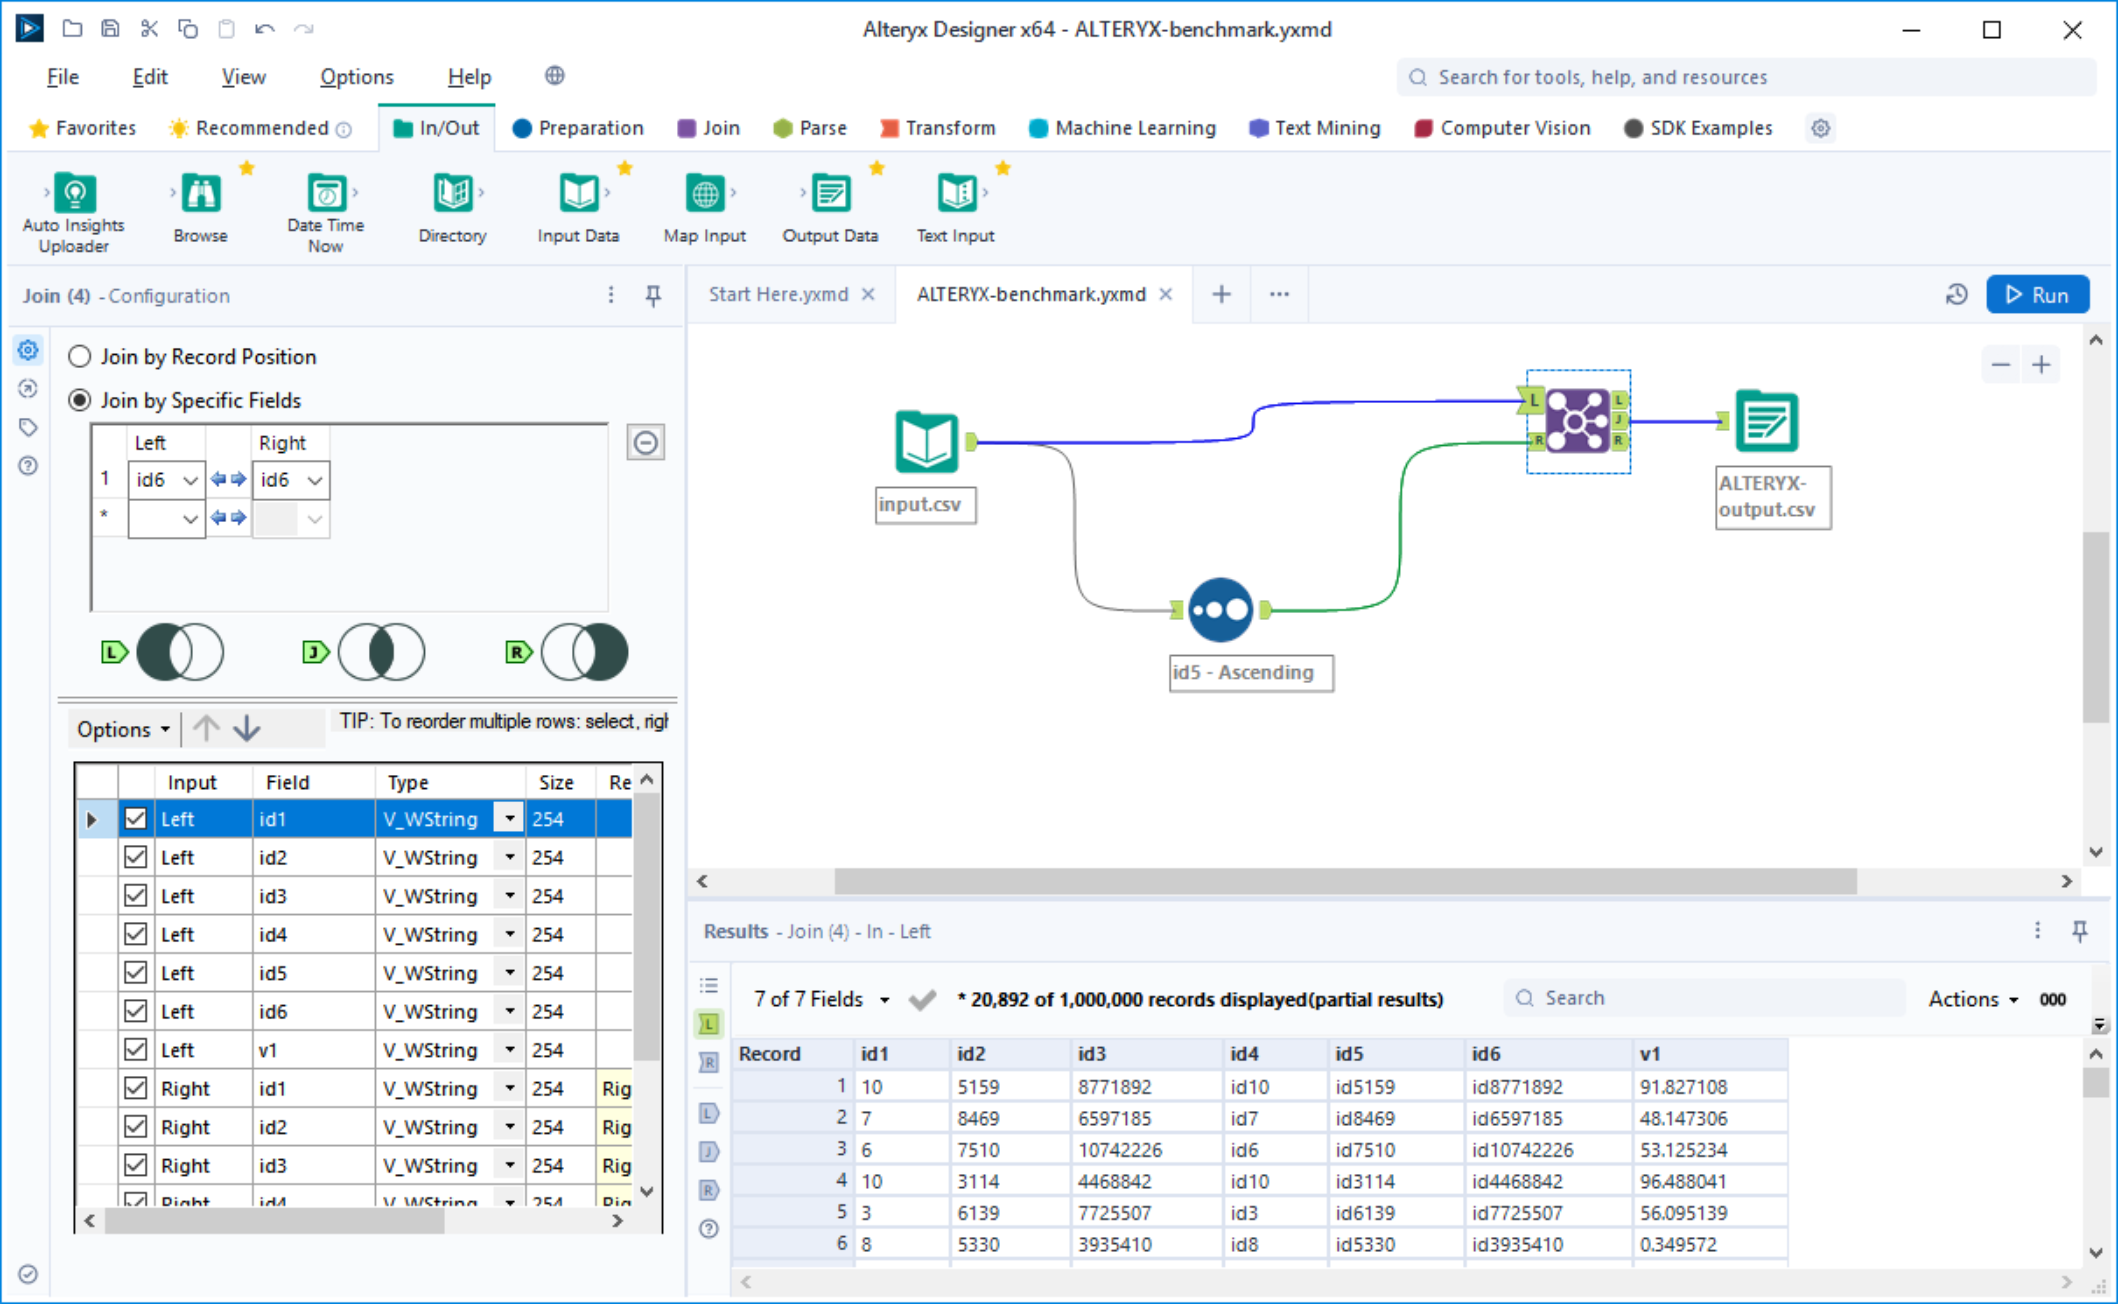
Alteryx
Alteryx Prep is a graphical drag and drop tool for data wrangling and analytics. It is only available for Windows.
We wanted to include Alteryx in this benchmark. However their license explicitly forbids this under the 2.4 USES NOT PERMITTED clause.
There is a 2018 article on the Alteryx blog comparing Alteryx vs Python + Pandas performance.
With Alteryx it seems that you have to run the whole workflow via Option>Run Workflow. We couldn’t see any way to run one transform at a time or run only changes.
The cost of an Alteryx desktop license is approximately $5k per year.
You can download a free trial of Alteryx here. You have to provide your details (twice - once on the website, once when you start the trial).
Replication
You can download the scripts/workflows for each test and the input dataset here:
You will need to modify the input and output paths to appropriate locations for your own computer. The input dataset was obtained from running:
RScript.exe data.R 1e7 1e2 0 0
Where data.R was obtained from https://github.com/h2oai/db-benchmark. We then sampled the first million rows of the J1_1e7_NA_0_0.csv dataset created.
Updates
28-Nov-2022:
Added in R + data.table and R + dplyr results.
Removed comments about Pandas running on the GPU (apparently, it doesn’t).
Thanks
Thanks to Viriaro on the Reddit Rlanguage forum for data.table and dplyr examples (which we mangled to fit more closely with the other benchmarks).
[1]ETL=Extract Transform Load.
[2]GPU=Graphics Processing Unit.