Datasets will often contain statistical outliers, particularly when the dataset is collected from self-reported sources, such as online surveys. These outliers can badly skew the results, so they need to be dealt with before the dataset can be used. Easy Data Transfrom can help you easily find and deal with statistical outliers.
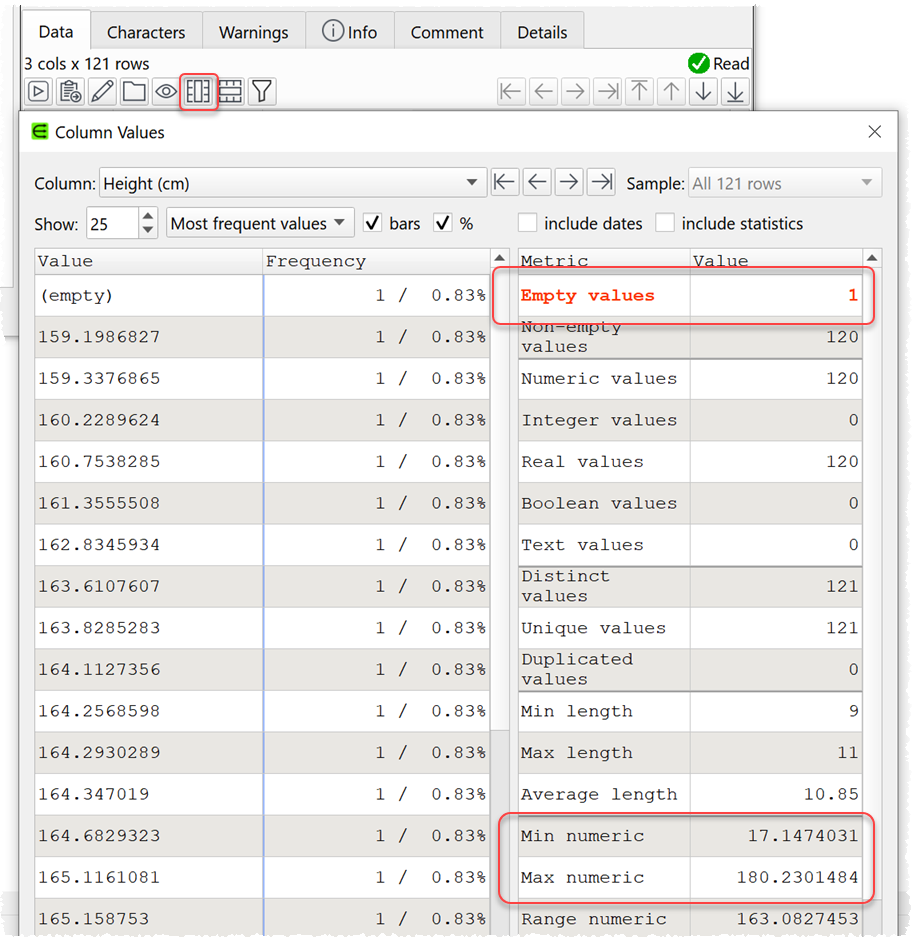
The simplest way to find outliers is to profile the data by column. This will allow you to find suspicious looking minimum and maximum values. It will also show any non-numeric values.

You can then edit the original data or use a Replace transform (to replace problem values) or a Filter transform (to remove problem rows).
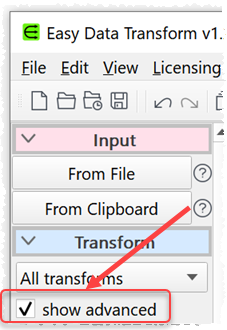
The Outliers transform allows a more sophisticated approach finding statistical outliers in data, based on either the IQR (inter quartile range) or the standard deviation of the data in a column. Check show advanced in the Left pane to show the Outliers transform.

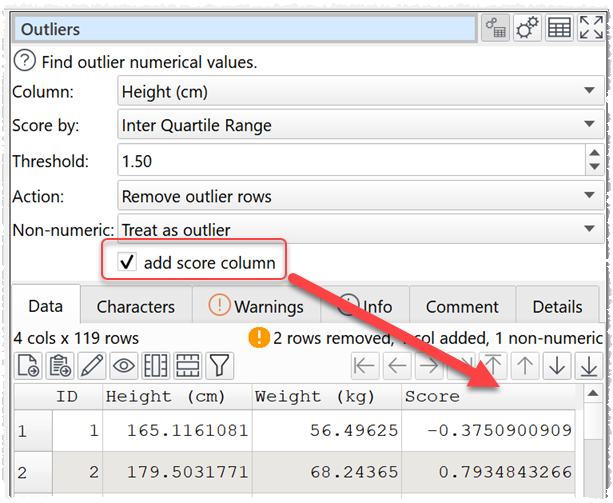
Select the column of data you want to analyze for outliers. Set Score by depending if you want to score values based on either the IQR or standard deviation. Set Threshold depending according to how wide a range you expect the data to have (where the upper and lower fences are).
For example:
- If you set Score by to Inter Quartile Range and Threshold to 1.5 and the IQR is calculated as 10.0, then anything more than 15.0 above the Q3 value or less than 15.0 below the Q1 value is an outlier.
- If you set Score by to Standard Deviation and Threshold to 1.5 and the standard devation is calculated as 10.0, then anything more than 15.0 above or less than 15.0 below the average (mean) value is an outlier. The number of standard deviations from the mean is also known as the Z-score.
Check add score column to add a column showing the score for each value.

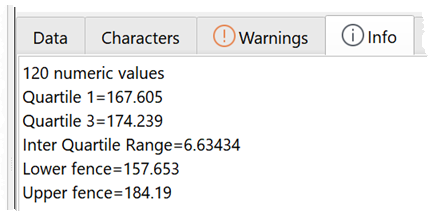
The Warnings tab warns you about any non-numeric values, and the Info tab gives you information on the IQR/standard deviation.

Set Action according to the action to take for values identified as outliers:
- Change to threshold: Value greater than the upper fence value or less than the lower fence value are set to the nearest fence value. Non-numeric values are not changed, as it isn’t clear which fence value to set them to.
- Remove outlier rows: Rows with outlier values are removed.
- Keep outlier rows: Only rows with outlier values are kept.
- Set value: Outlier values are changed to the value provided in the Value field.
See the video above for more details.
Easy Data Transform can also help with merging, cleaning, filtering, enriching and reshaping your data. All with a few clicks and no coding required.
 Windows Download
 Mac Download