As described in this paper by Hadley Wickham, tidy data exhibits the following characteristics:
- Each variable forms a column.
- Each observation forms a row.
- Each observational unit forms a table.
Data not in this form is messy data. Messy data is often more compact, but tidy data is generally much easier to work with.
You can use Easy Data Transform to convert messy data into tidy data in a few clicks, as the following examples, based on the paper, show.
Install Easy Data Transform on your PC or Mac, if you haven’t done so already. It will only take a minute. There is a fully functional free trial and you don’t have to give us your email or sign up to anything.
Start Easy Data Transform. Make sure the Auto Run button is pressed in.
Example 1
This table on US income and religion has variables as both rows and columns:
| religion | <$10k | $10-20k | $20-30k | $30-40k | $40-50k | $50-75k |
|---|---|---|---|---|---|---|
| Agnostic | 27 | 34 | 60 | 81 | 76 | 137 |
| Atheist | 12 | 27 | 37 | 52 | 35 | 70 |
| Buddhist | 27 | 21 | 30 | 34 | 33 | 58 |
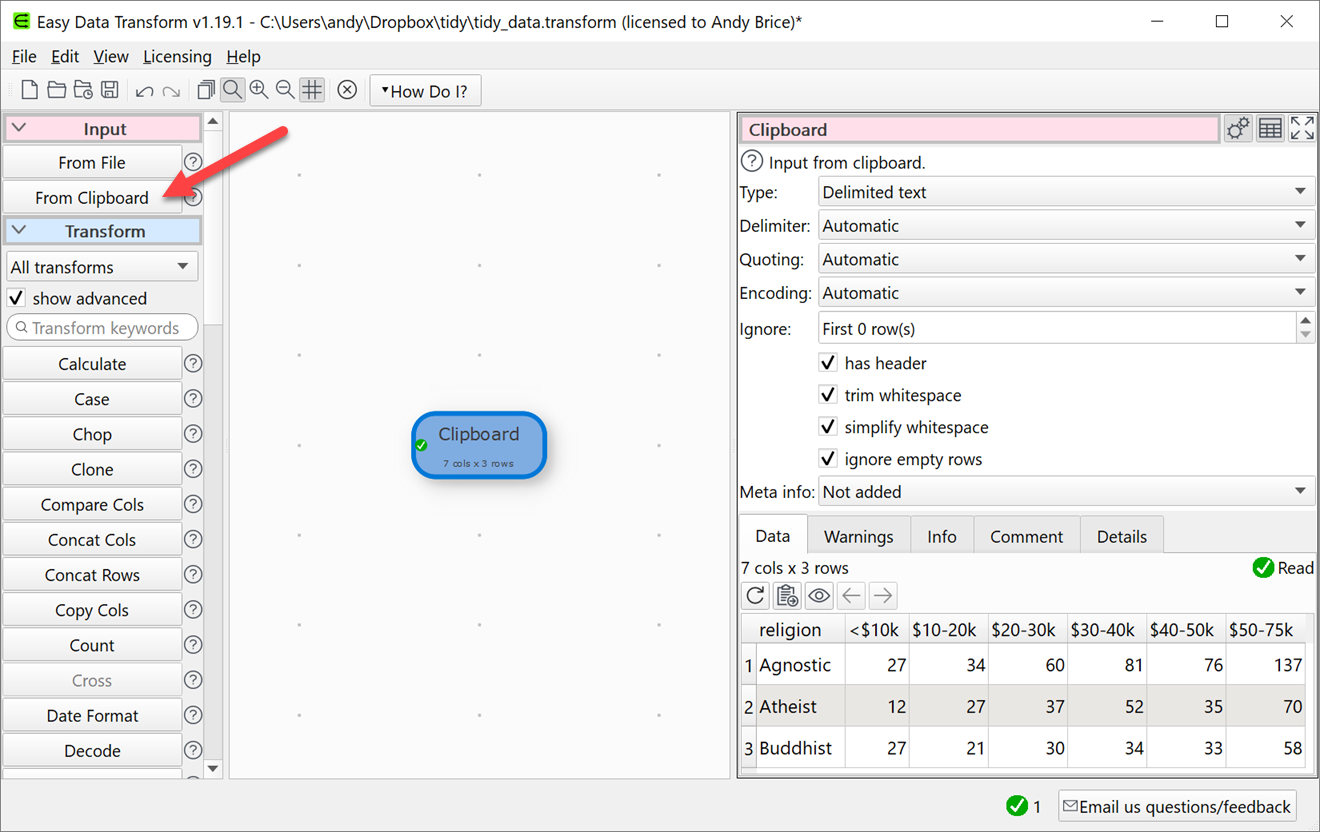
Highlight the above table and copy it to the clipboard. Then click the From Clipboard button in Easy Data Transform. A new input item will appear containing the table data.
Ensuring that show advanced is checked and the Clipboard item is selected, click on the Gather button in the Left pane. Then set the Right pane options as shown below:
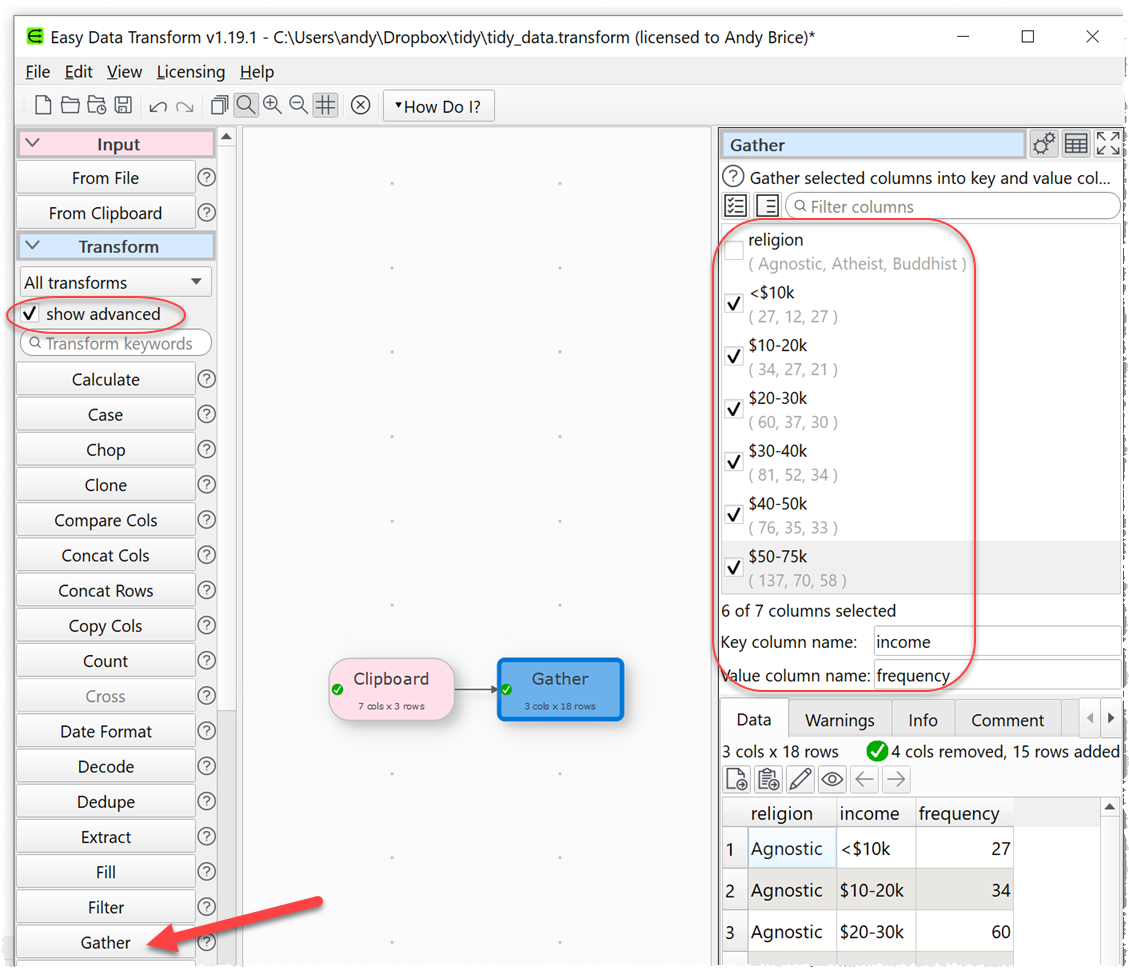
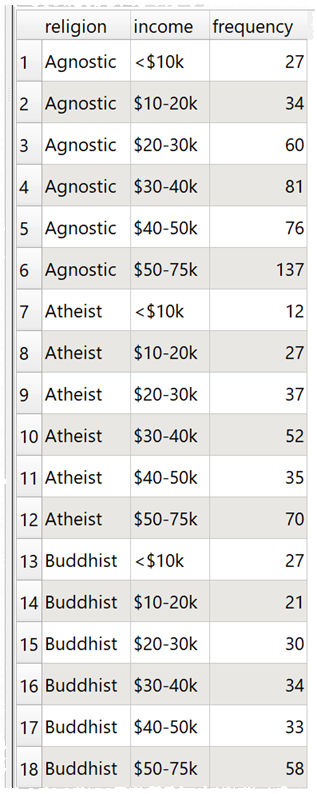
The data is now rearranged into tidy data:
You could now click To File at the bottom of the Left pane if you wanted to save the tidy data to a file.
Example 2
This table of song chart positions is messy because there are multiple observations of the song position on each row:
| year | artist | track | time | date.entered | wk1 | wk2 | wk3 |
|---|---|---|---|---|---|---|---|
| 2000 | 2 Pac | Baby Don’t Cry | 4:22 | 2000-02-26 | 87 | 82 | 72 |
| 2000 | 2Ge+her | The Hardest Part Of … | 3:15 | 2000-09-02 | 91 | 87 | 92 |
| 2000 | 3 Doors Down | Kryptonite | 3:53 | 2000-04-08 | 81 | 70 | 68 |
Highlight the above table and copy it to the clipboard. Then click the From Clipboard button in Easy Data Transform. A new input item will appear containing the table data.
Ensuring that the new Clipboard item is selected, click on the Gather button in the Left pane. Then set the Right pane options as shown below:
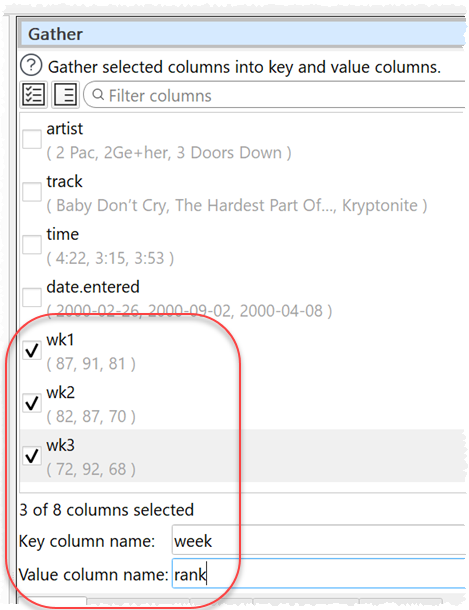
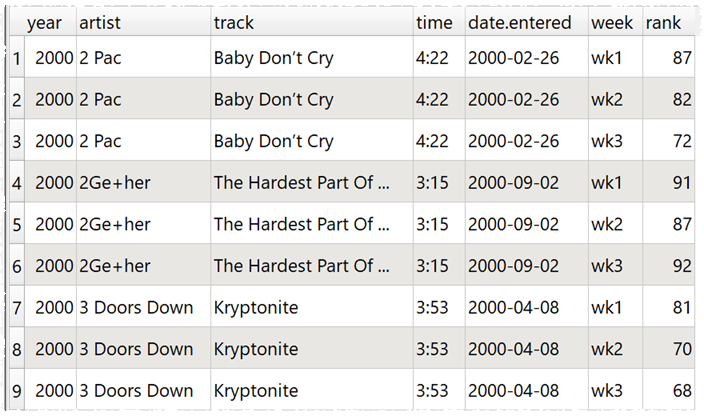
The data is now tidy:
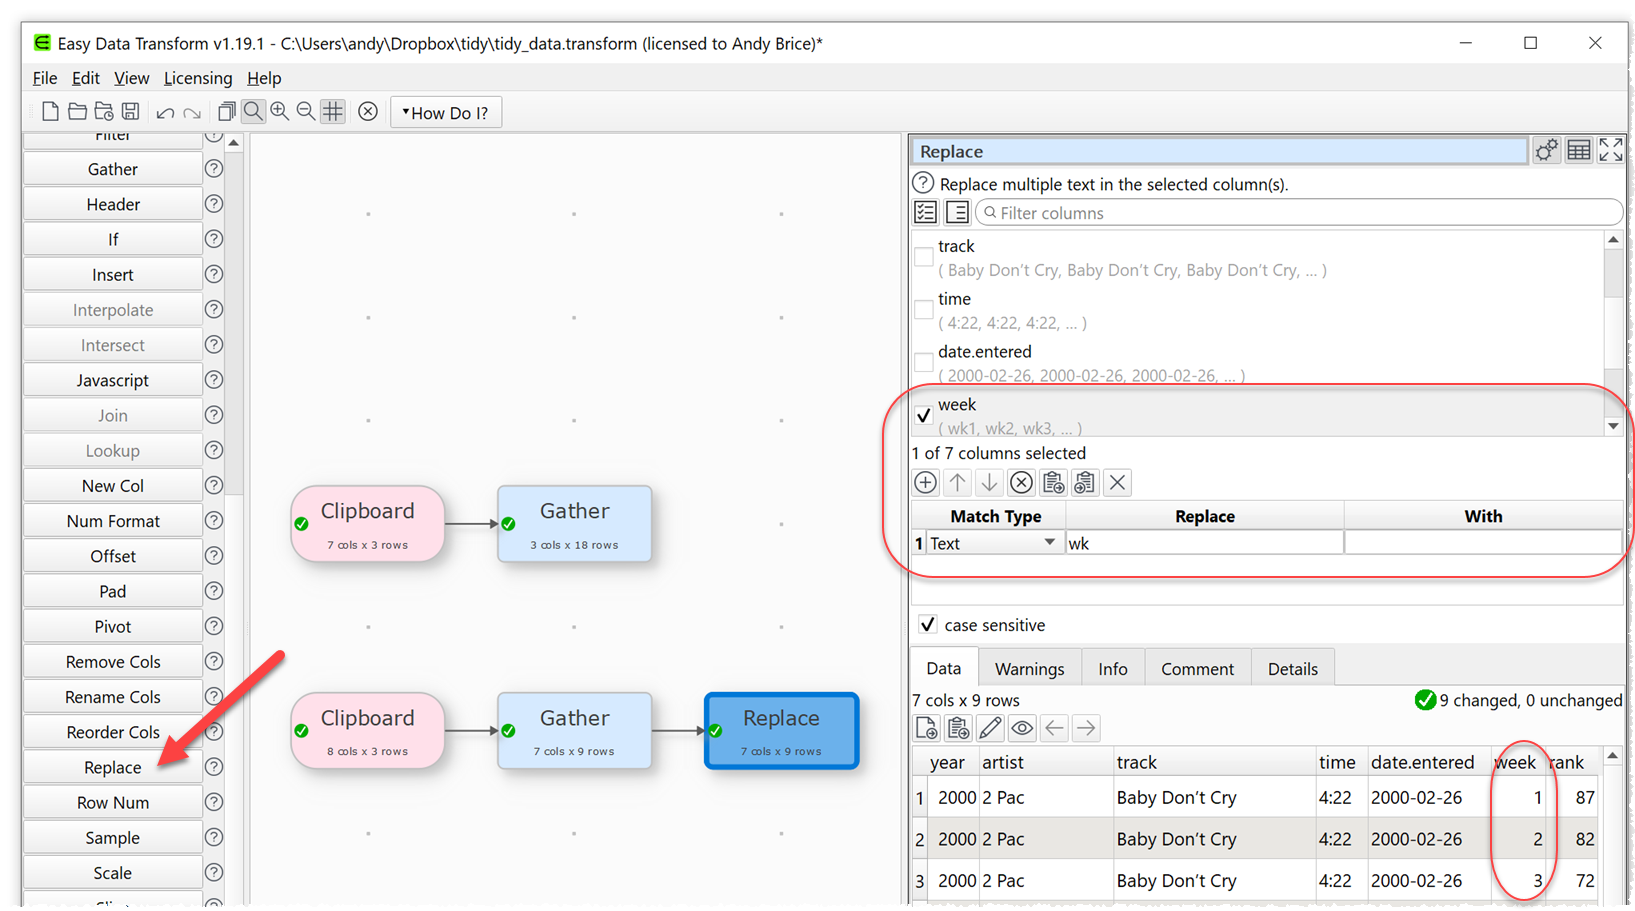
To change the week into a number, use the Replace transform. With the new Gather item selected, click the Replace button in the Left pane. In the Right pane:
- select the week column
- leave the Match Type as Text.
- set the Replace value to wk.
- leave the With value empty.
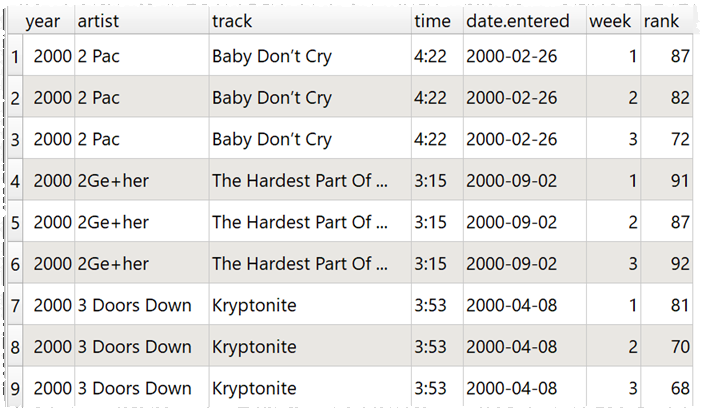
Here is the cleaned up tidy data:
Example 3
This table is messy because there are multiple observations per row and also the columns contain both gender and age information:
| country | year | m014 | m1534 | m3564 | m65 | f014 | f1534 | f3564 | f65 |
|---|---|---|---|---|---|---|---|---|---|
| AD | 2000 | 0 | 0 | 1 | 0 | 0 | 0 | 0 | 0 |
| AE | 2000 | 2 | 4 | 4 | 6 | 5 | 12 | 10 | 6 |
| AF | 2000 | 52 | 228 | 183 | 149 | 129 | 94 | 80 | 149 |
Highlight the above table and copy it to the clipboard. Then click the From Clipboard button in Easy Data Transform. A new input item will appear containing the table data.
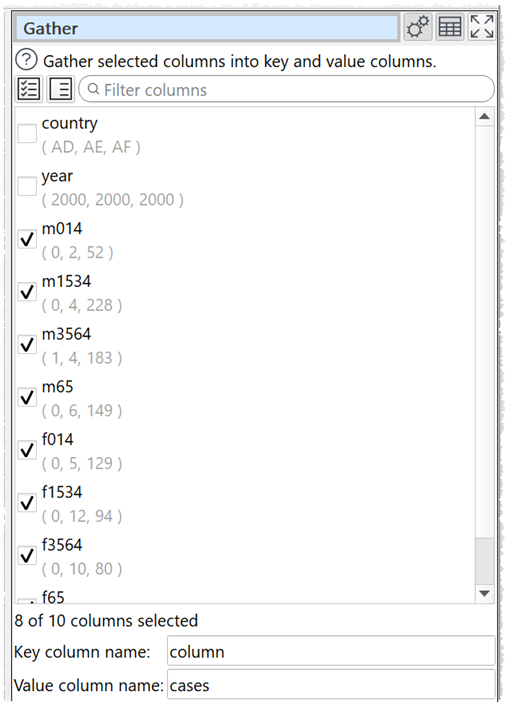
Ensuring that the new Clipboard item is selected, click on the Gather button in the Left pane. Then set the Right pane options, checking all the gender/age columns, as shown below:
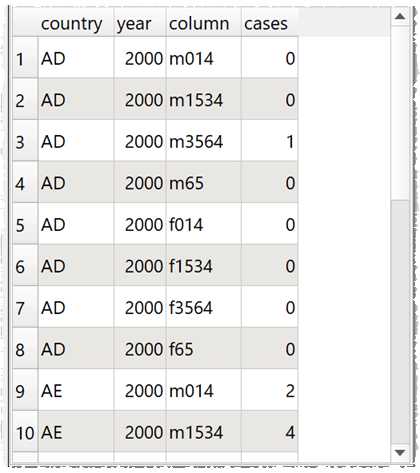
This transforms the data into one observation per row:
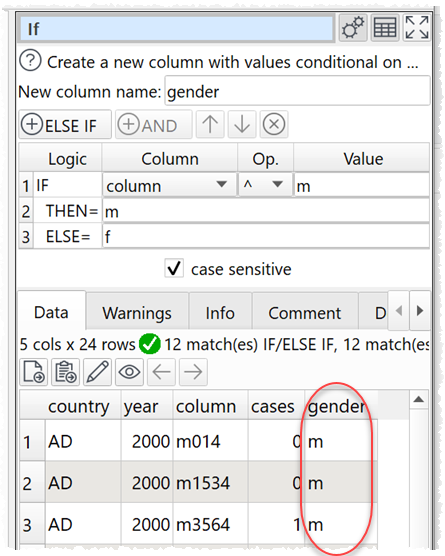
We now need a little more work to separate out the gender and age. Add an If transform to add a new gender column:
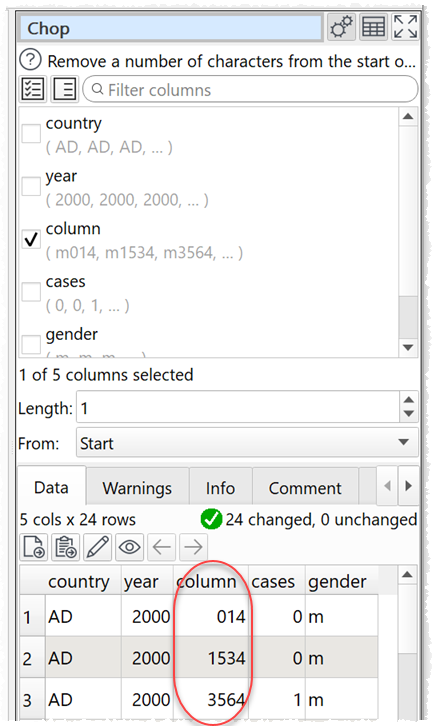
Add a Chop transform to remove the gender from the column column:
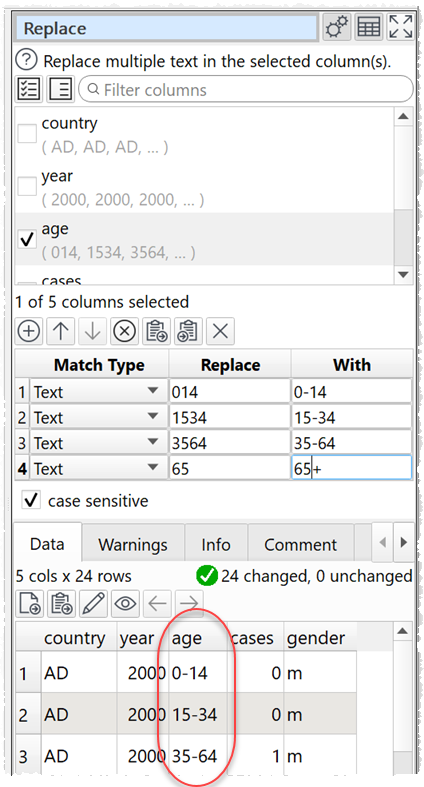
Add a Rename Cols transform to rename the column column to age and a Replace transform to make the age ranges clearer:
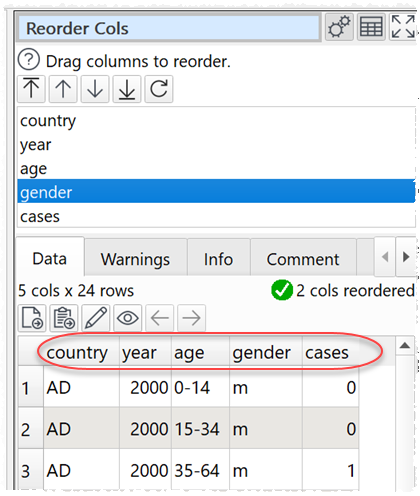
And finally add a Reorder Cols transform to change the column order:
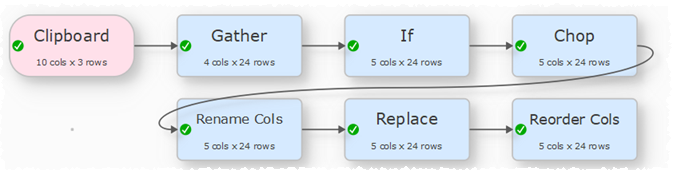
The Center pane should now look something like this:
Example 4
This table is messy because there are multiple observations per row, the date is spread over several columns and tmax and tmin values are stored in the same columns:
| id | year | month | element | d1 | d2 | d3 | d4 | d5 | d6 | d7 | d8 |
|---|---|---|---|---|---|---|---|---|---|---|---|
| MX17004 | 2010 | 1 | tmax | — | — | — | — | — | — | — | — |
| MX17004 | 2010 | 1 | tmin | — | — | — | — | — | — | — | — |
| MX17004 | 2010 | 2 | tmax | — | 27.3 | 24.1 | — | — | — | — | — |
| MX17004 | 2010 | 2 | tmin | — | 14.4 | 14.4 | — | — | — | — | — |
| MX17004 | 2010 | 3 | tmax | — | — | — | — | 32.1 | — | — | — |
| MX17004 | 2010 | 3 | tmin | — | — | — | — | 14.2 | — | — | — |
Highlight the above table and copy it to the clipboard. Then click the From Clipboard button in Easy Data Transform. A new input item will appear containing the table data.
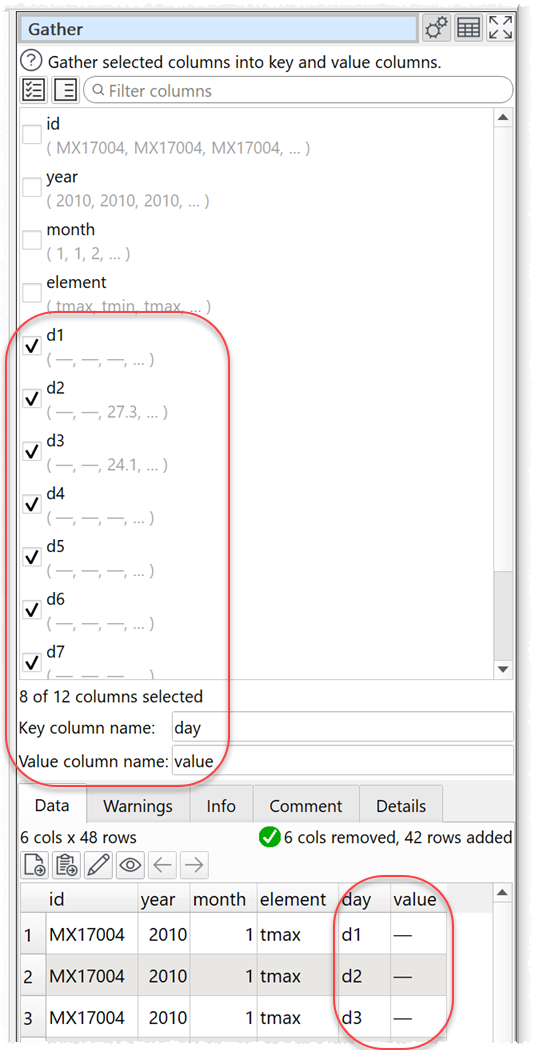
Ensuring that the new Clipboard item is selected, click on the Gather button in the Left pane. Then set the Right pane options, checking the d1 … d8 columns as shown below:
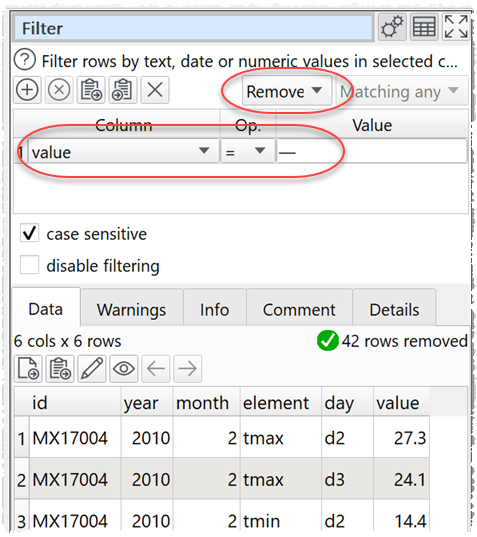
Use a Filter transform to remove rows with no useful information:
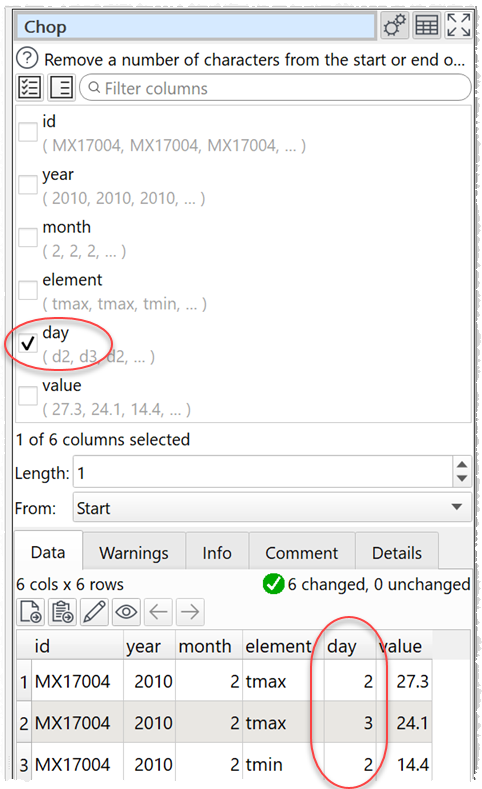
Now we can construct a date column. Use the Chop transform to remove the ‘d’ prefix from the day column:
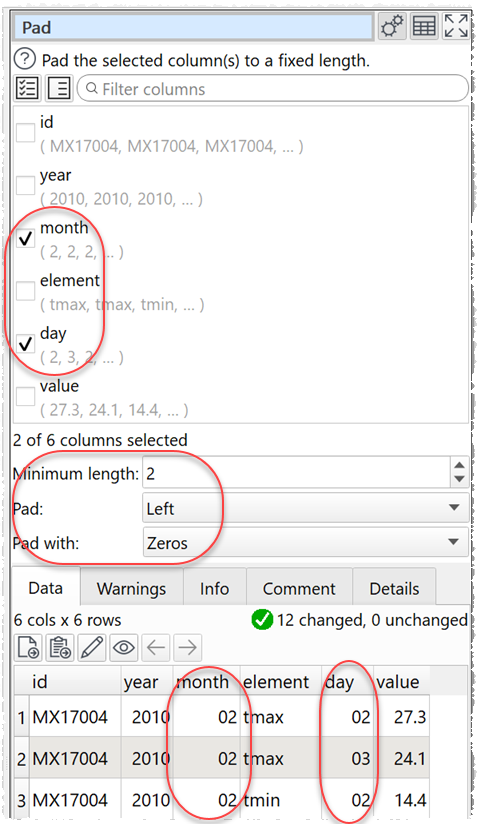
Use the Pad transform to pad the month and day columns with leading zeros:
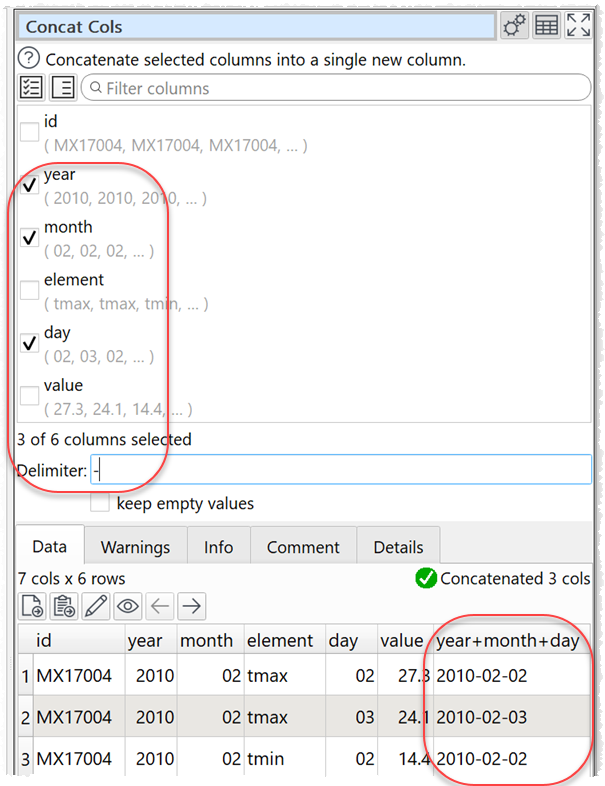
Concatenate the 3 date columns using the Concat Cols transform with ‘-‘ as the Delimiter:
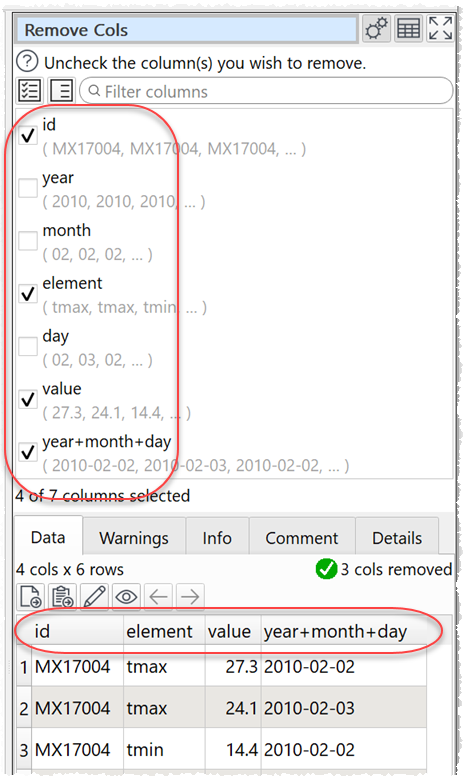
Use the Remove Cols transform to remove year, month and day columns:
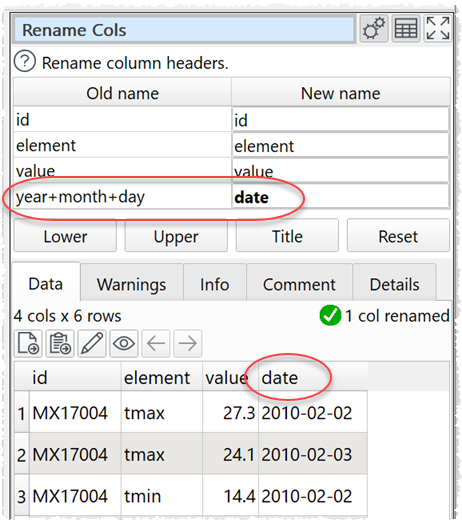
And rename the date column using the Rename Cols transform:
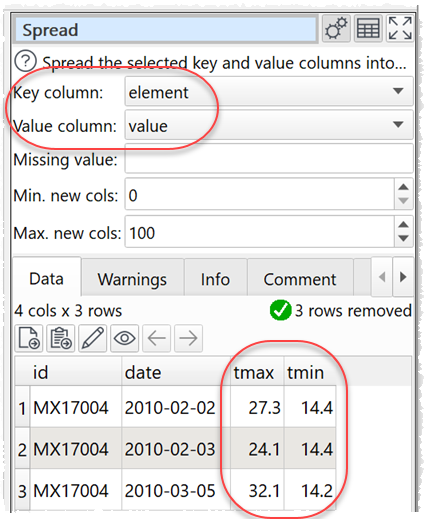
Finally we can use the Spread transform to separate out tmax and tmin into separate columns:
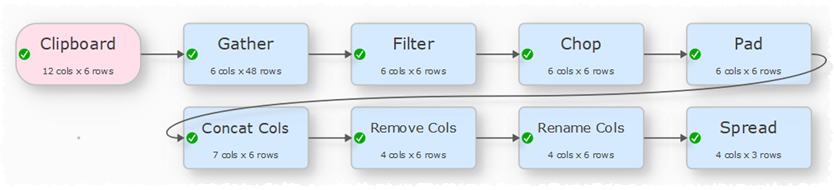
The Center pane should now look something like this:
You can download a Easy Data Transform .transform file with the above 4 examples. File>Open it in Easy Data Transform.
As well as converting messy data to tidy data, Easy Data Transform also allows you to combine 74 transforms to quickly and easily get your data in the form you need it.
 Windows Download
 Mac Download