Easy Data Transform has multiple ways to merge two datasets together, including with numerical values, such as timestamps.
If you want to merge 2 sets of timestamped data, and they have identical timestamps, you can do so using a Join transform. But, if the timestamps don’t exactly match up (e.g. they have different intervals), you can easily merge them using the Interpolate transform. Here is a simple example of merging timestamped solar panel and weather station data.
- Install Easy Data Transform on your PC or Mac, if you haven’t done so already. It will only take a minute. There is a fully functional free trial and you don’t have to give us your email or sign up to anything.
- Start Easy Data Transform. Make sure the Auto Run button is pressed in.
- Download files solar.zip and unzip it into solar.csv and weather.csv.
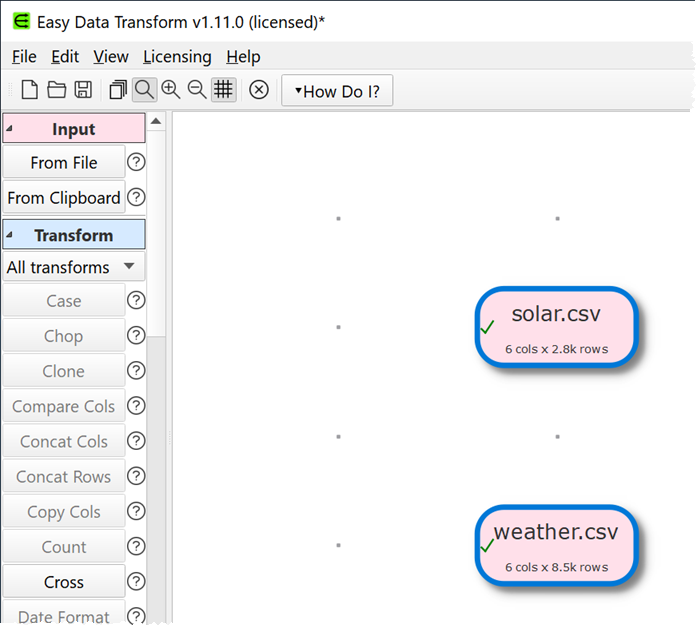
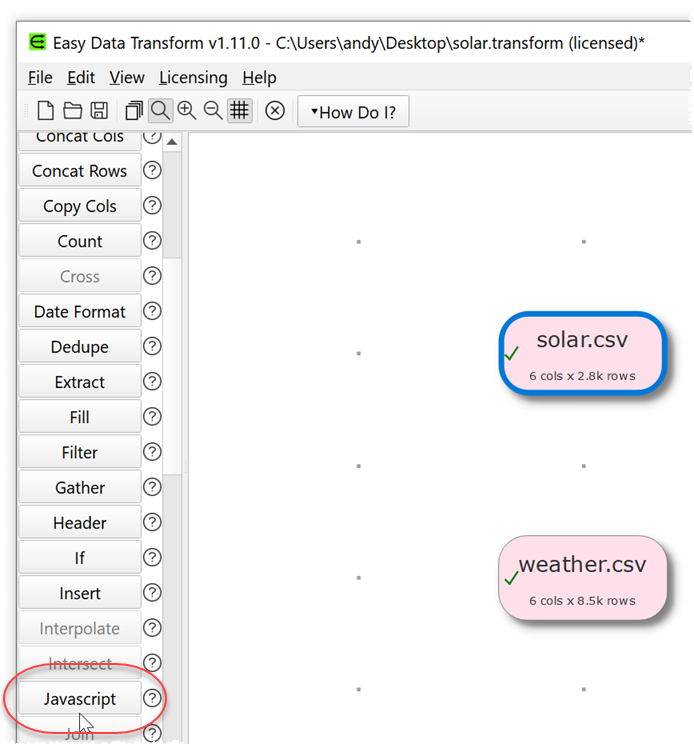
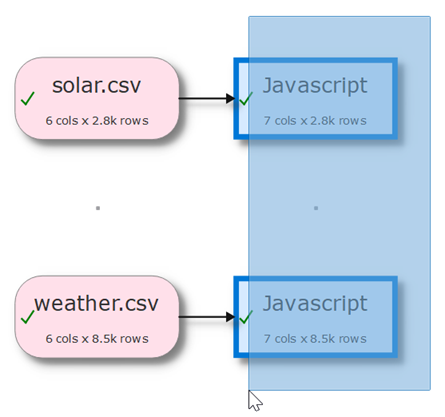
- Drag the two .csv data files onto Easy Data Transform. Drag the files so that solar.csv is vertically above weather.csv as we want to merge weather.csv into solar.csv (not vice versa).
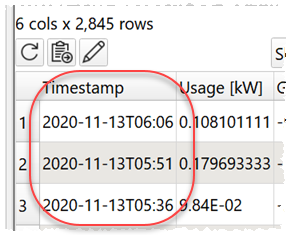
- If you look in the Right pane with either of the datasets selected you will see that the timestamp data is in ISO datetime format. The solar data is approximately one row per 15 minutes and the weather data is approximately one row per 5 minutes. We can interpolate the weather data values to fit the timestamps of the solar data. But first we need to convert the timestamp to a numerical value, so we can interpolate it. We just need 1 line of Javascript to do that.
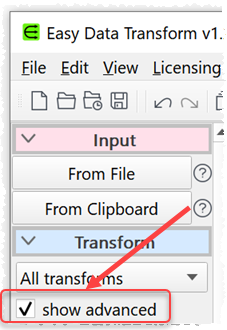
- Select only the pink solar.csv input and click the Javascript button in the Left pane. You may need to scroll the Left pane down to see the button. If the button isn’t showing, check show advanced in the Left pane.
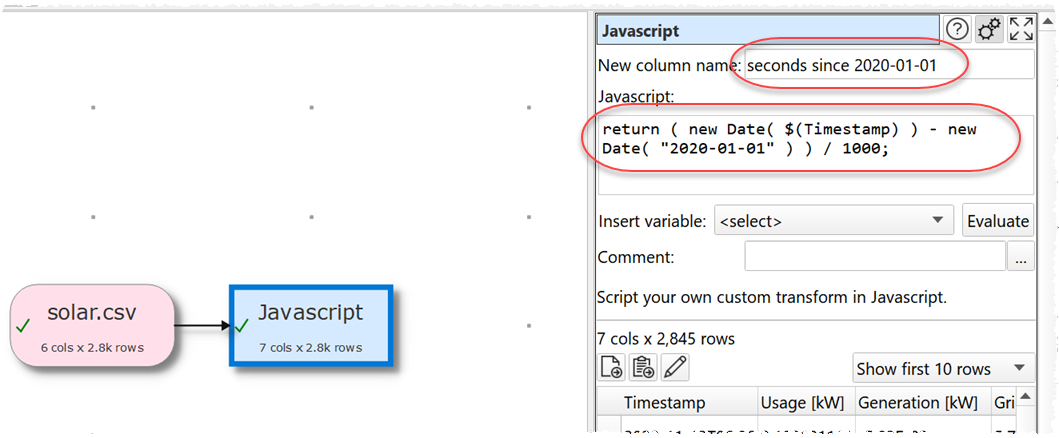
- A Javascript transform will be added. In the Right pane replace the contents of the Javascript field by copying and pasting in:
return ( new Date( $(Timestamp) ) - new Date( "2020-01-01" ) / 1000;
- And set New column name to:
Seconds since 2020-01-01
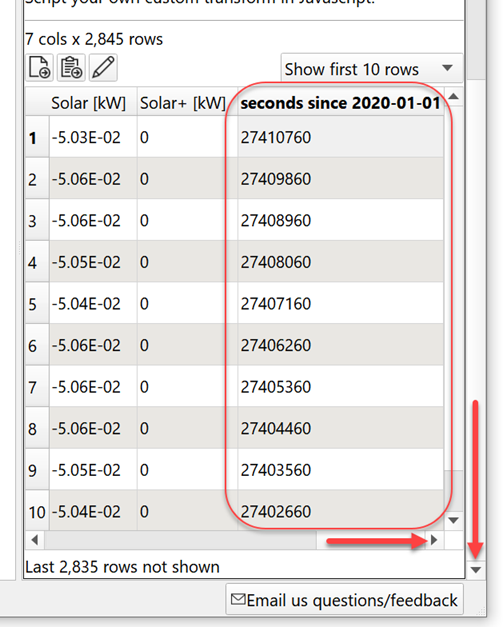
- Click the Evaluate button. If you scroll the data table to the right, you should see a new column at the end called Seconds since 2020-01-01.
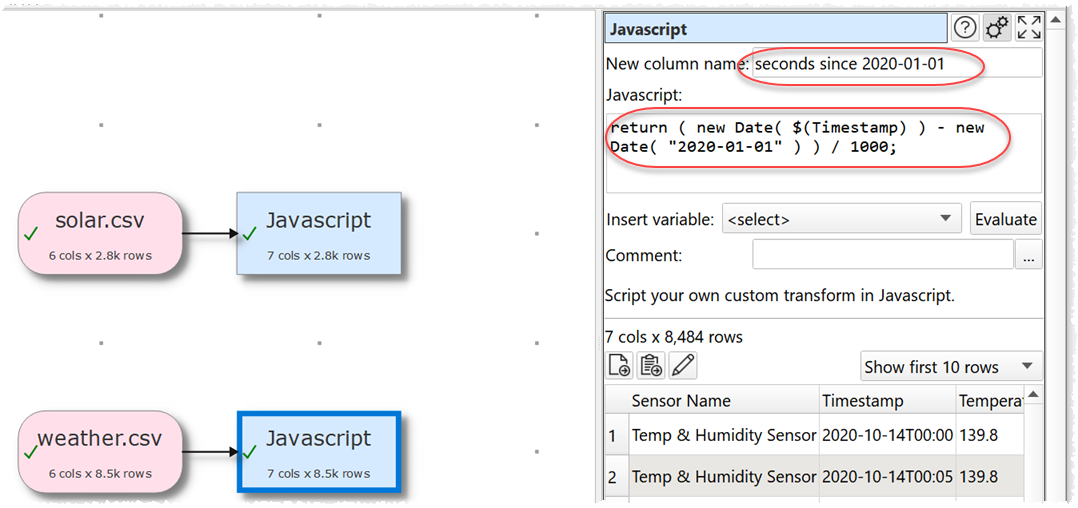
- Repeat the above process for weather.csv so both have an additional Seconds since 2020-01-01 column.
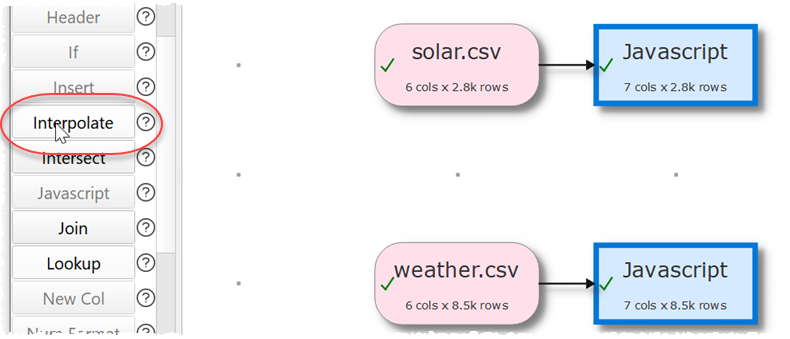
- Select both Javascript items by dragging a box around them (but not around the connecting arrows).
- Click the Interpolate button in the left hand pane.
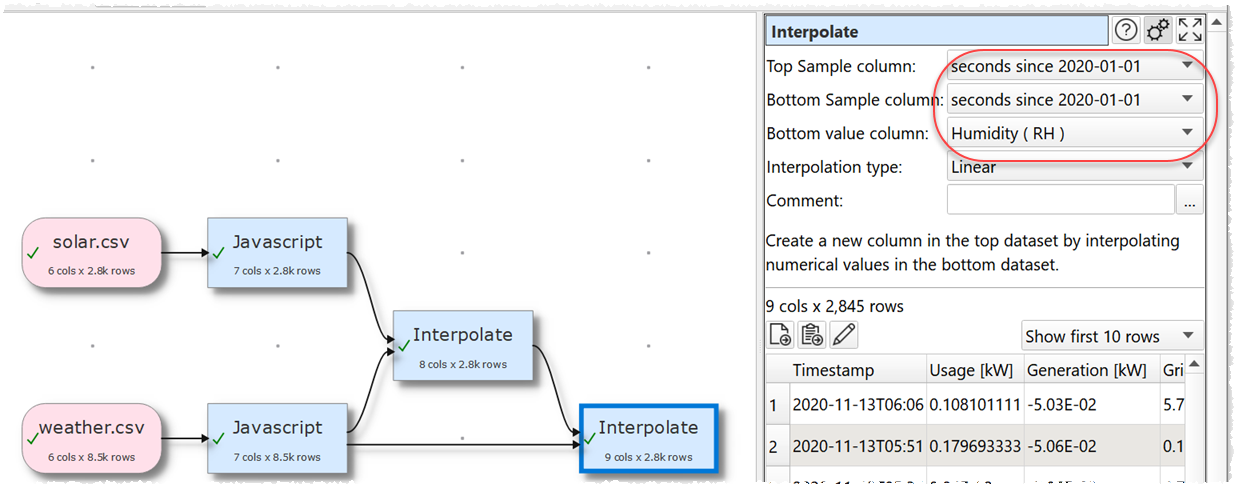
- A new Interpolate transform will be added. With the new Interpolate item selected, in the Right pane set Top sample column and Bottom sample column to Seconds since 2020-01-01 and the Bottom value column to Temperature (F).
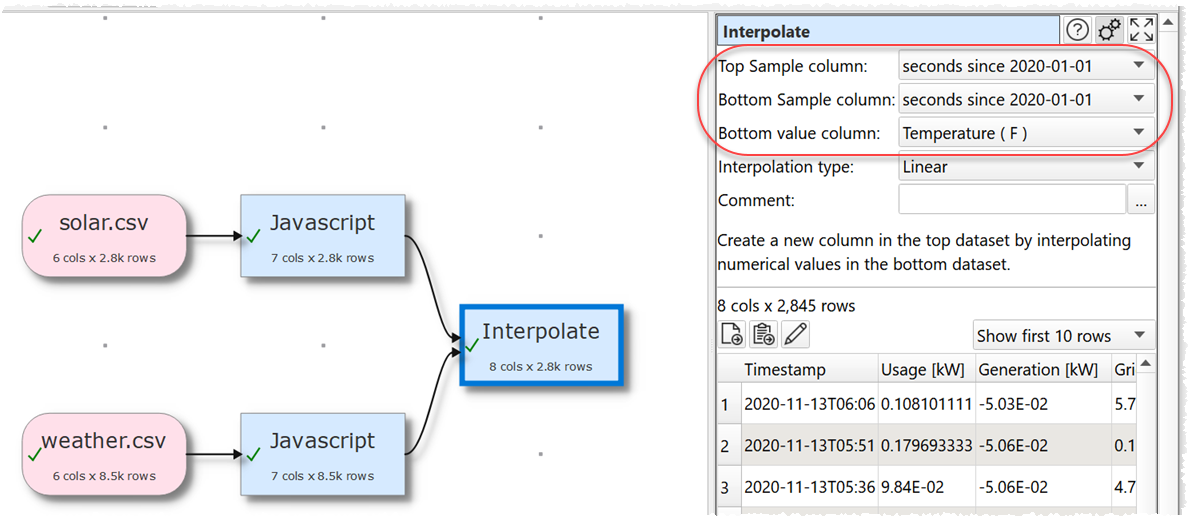
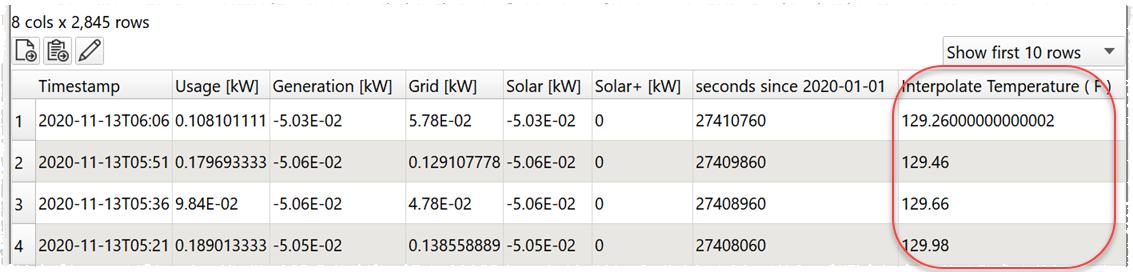
- A new column with the interpolated temperature values will be added at the end.
- To merge in the weather humidity data just repeat the above process. Click to select the new Interpolate transform and Ctrl+click(Windows)/Cmd-click(Mac) to select the bottom Javascript transform, then click on the Interpolate button. Then set the values in the Right pane as shown.
-
We can then use various other transforms such as: Remove Cols or Rename Cols to tidy up our columns, Filter to remove rows outside the desired date range and Num Format to set the number of decimal places for the interpolated values.
-
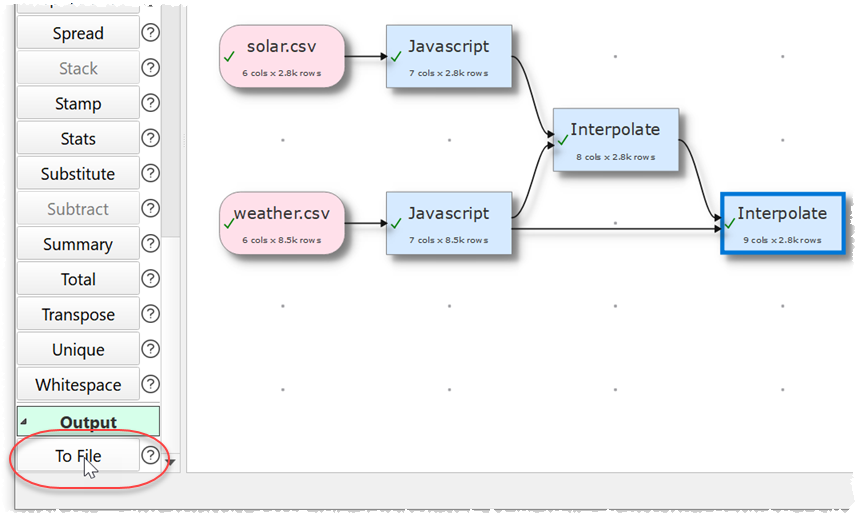
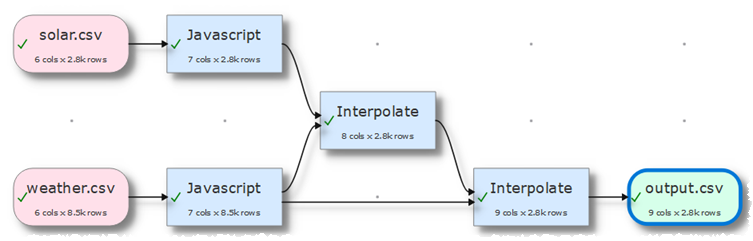
We can now export the merged data. With the second Interpolate item selected click on the To File button in the Left pane (you may need to scroll down to see it).
- Choose the output file location and format.
- Finally you can File>Save your transforms as a .transform file to re-use in the future.
If you need to show duplicates in lots of Excel sheets you can do it in a single operation using the batch processing feature.
As well as interpolating data, Easy Data Transform also allows you to combine 74 transforms in many other ways to quickly and easily create complex data transformations for numerical, text and date data.
 Windows Download
 Mac Download